It’s vital for governments and environmental protection organizations to monitor and measure coastline erosion and modification over time. Councils need to take surveys every few years to keep everything in check, developers need to measure their direct efforts in modifying the shoreline to meet design, as well as assess and mitigate any negative effect they might be having on the environment and coastal and civil engineers need the data for their modelling and design work.
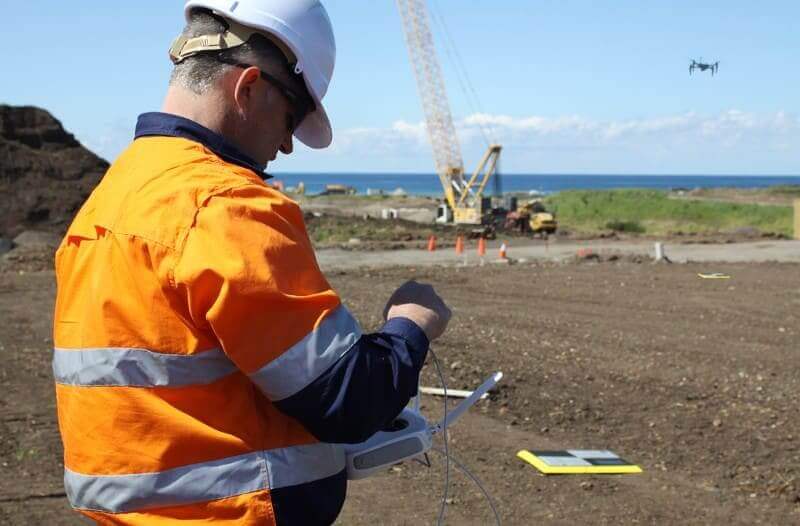
Whatever the application might be, you need accurate data that lines up over time. Drone surveying can give you the required level of accuracy (10–20mm horizontal and 20–40mm vertical)—provided that you are combining appropriate ground control, best flight practices, and appropriate post processing software.
If you choose to process your data on the Propeller Platform, there are some great tools that you can use to get the job done. This article is to demonstrate a couple of these tools.
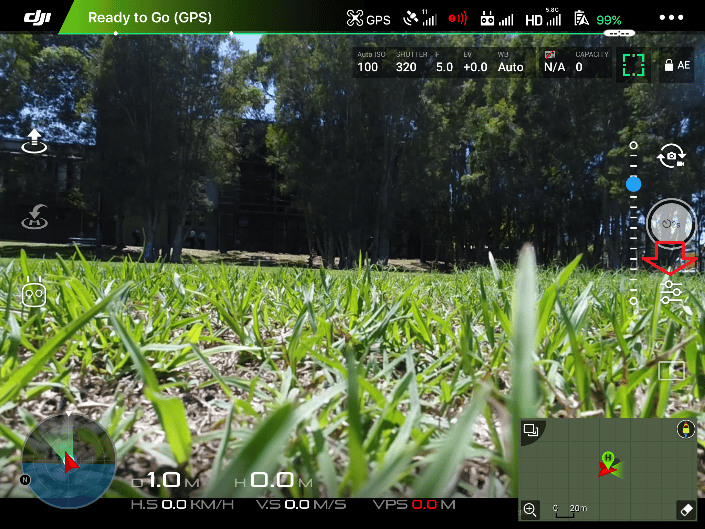
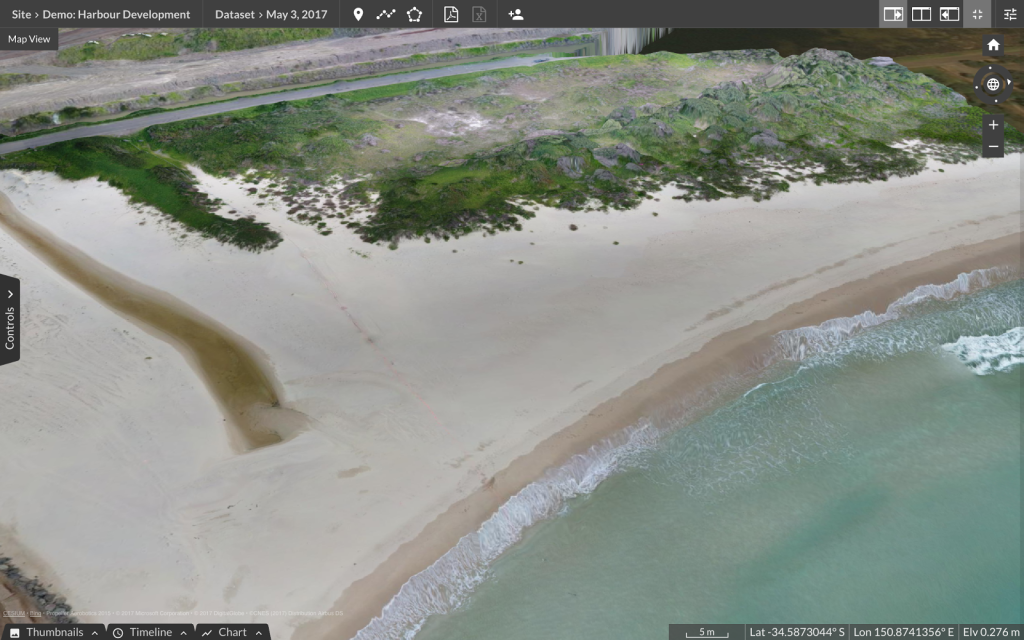
Here we have a beach that is being monitored as part of a Harbor Development Project:
Cross section surveying
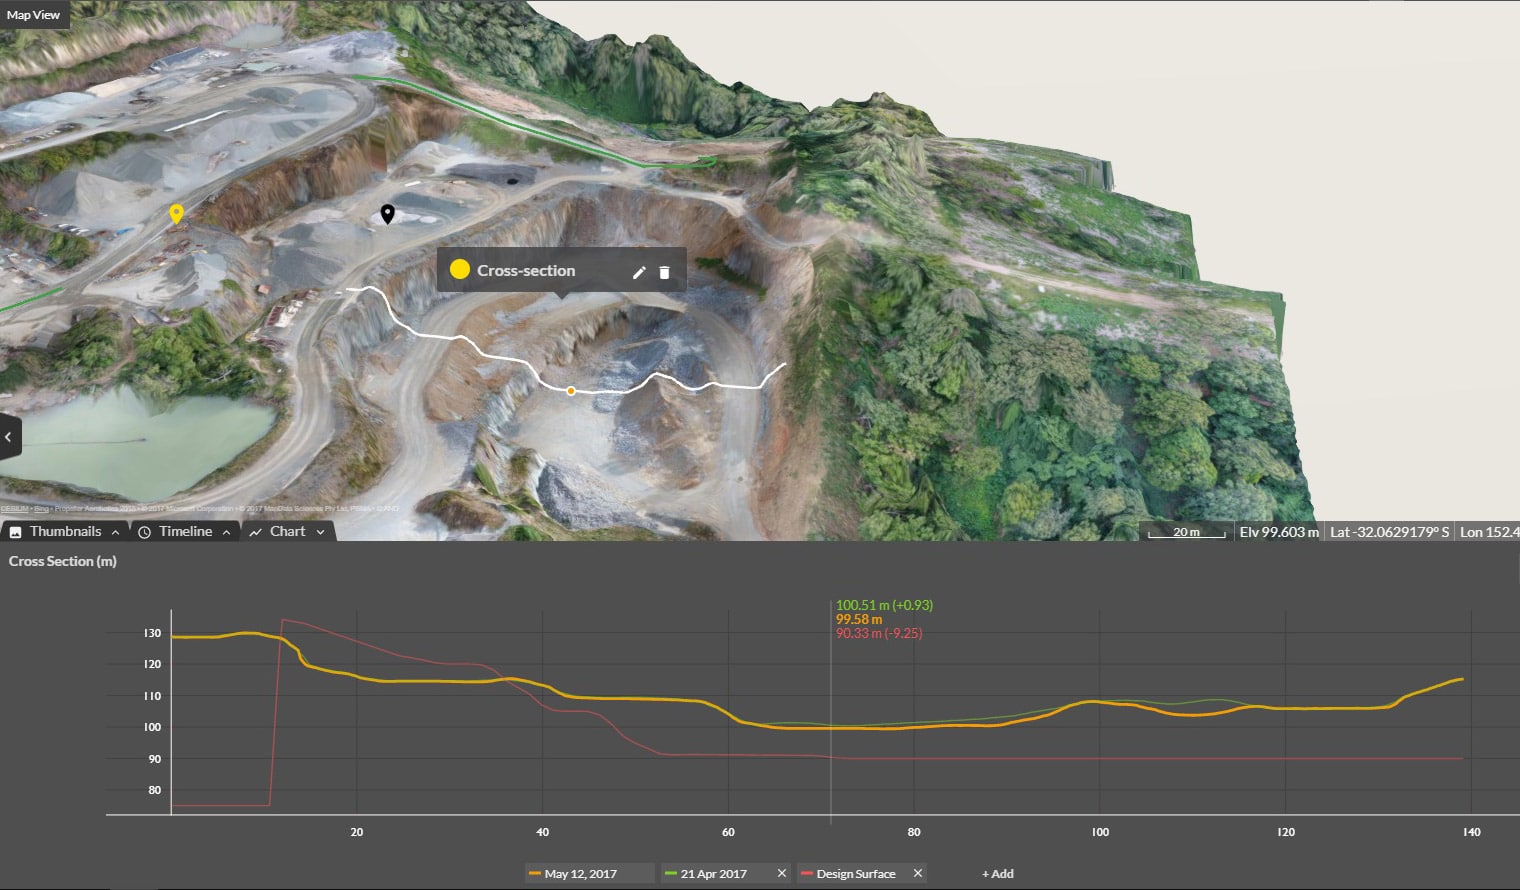
Using the Line tool, create a cross-section along the beach. Given it a name and a color and then expand the cross section chart under the map pane to get a better look at it.
Now, by moving your cursor along the cross sectional chart, it will give you the elevation of each point. Note that the position of the cursor on the chart will also be highlighted in 3D space for context.
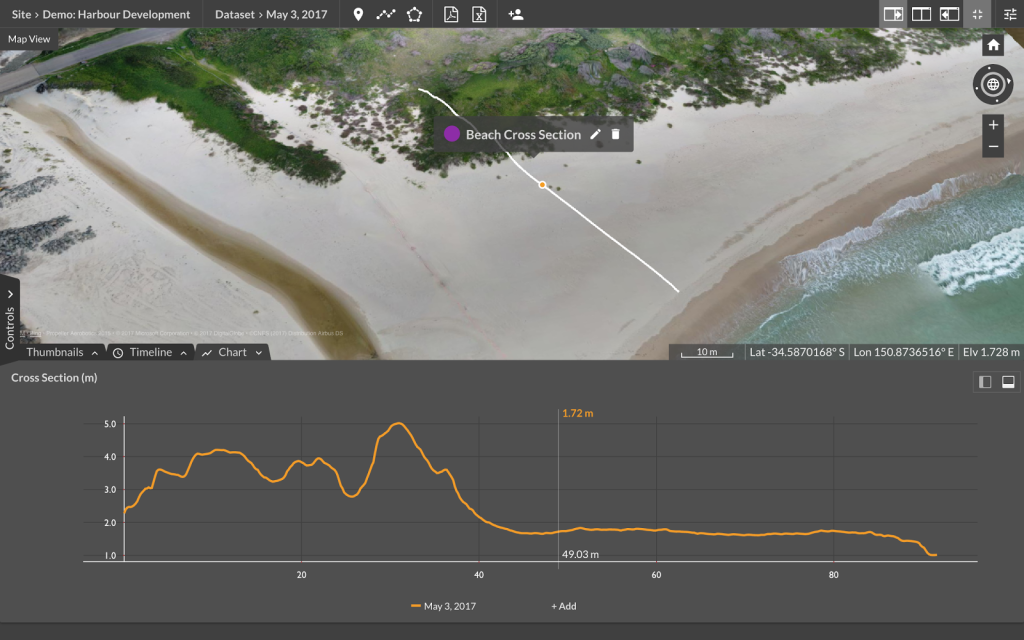
To compare the same cross section to another point in time, simply add another survey into the chart by clicking to an “+Add” button. Now when you hover your cursor over the chart, it will also give you the difference between the elevation of that point. On this example below, the difference is 2.84m.

You can add as many past surveys as you’d like, as well as design surfaces where appropriate. Again, all of the differences in elevation are calculated and displayed on the fly as you move your cursor.

Monitoring change of the area
The cross-section tool speeds up a lot of manual work (walking up and down the beach taking measurements), but since we have so much data at our disposal, why stop there? On the Propeller Platform, you can visualize and measure the difference between previous surveys or design surfaces.
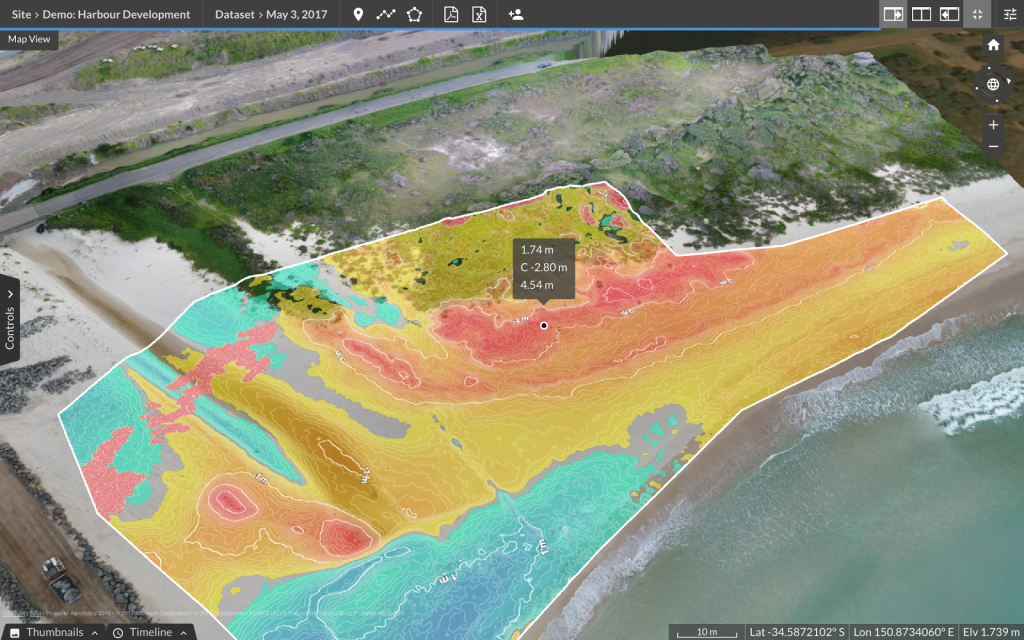
Using the polygon tool draw a polygon around the area you’d like to investigate. In the left panel, select volume comparison and the survey/design surface you’d like to compare against.
The Propeller Platform automatically calculates the cut (added sand), fill (lost sand) and net (total volumetric difference) values for you. You can hover your cursor over any point of the map and it will give you both elevations and the difference between them at that point.
Being a versatile tool, the Propeller Platform allows its users to use drone data for various conservation and environmental protection applications—offering a quick, easy, and cost-effective way to survey hard-to-access areas and track changes over time.