We’ve extolled the virtues of offloading your drone data processing before. In short, it means less time spent manually prepping your own surveys at a computer—and a specialized one with enough processing power to handle large datasets, at that—and more time for everything else you have to do today.
Still, we occasionally hear from people with concerns about turning over the processing keys to a third party. And we get that! Data security is a top priority for every surveying and construction technology professional. There’s also the issue of ownership. You need to trust in the data if you’re going to give a survey your seal of approval.

That’s why, every time we process a flight, we provide you with a detailed report that explains exactly how your data was evaluated, adjusted, and validated. It’s our way of giving you confidence in our ability to build actionable, highly accurate 3D site models for you and team.
What to use your processing report for
Our intention with this report is to help you understand the quality of the survey input data, how well it aligns with your ground control, and the overall accuracy of the survey.
We want to give construction surveyors and others evidence that their drone flight was conducted correctly and their survey data reflects the truth on the ground. If it meets their standards, they can feel confident sharing the survey data with their team. If it doesn’t, they have a road map for addressing problem areas before executing another flight.

The information in the report can be used to contextualize your models and other visual outputs, improve GCP placement for future surveys, and validate measurements using checkpoints with established coordinates.
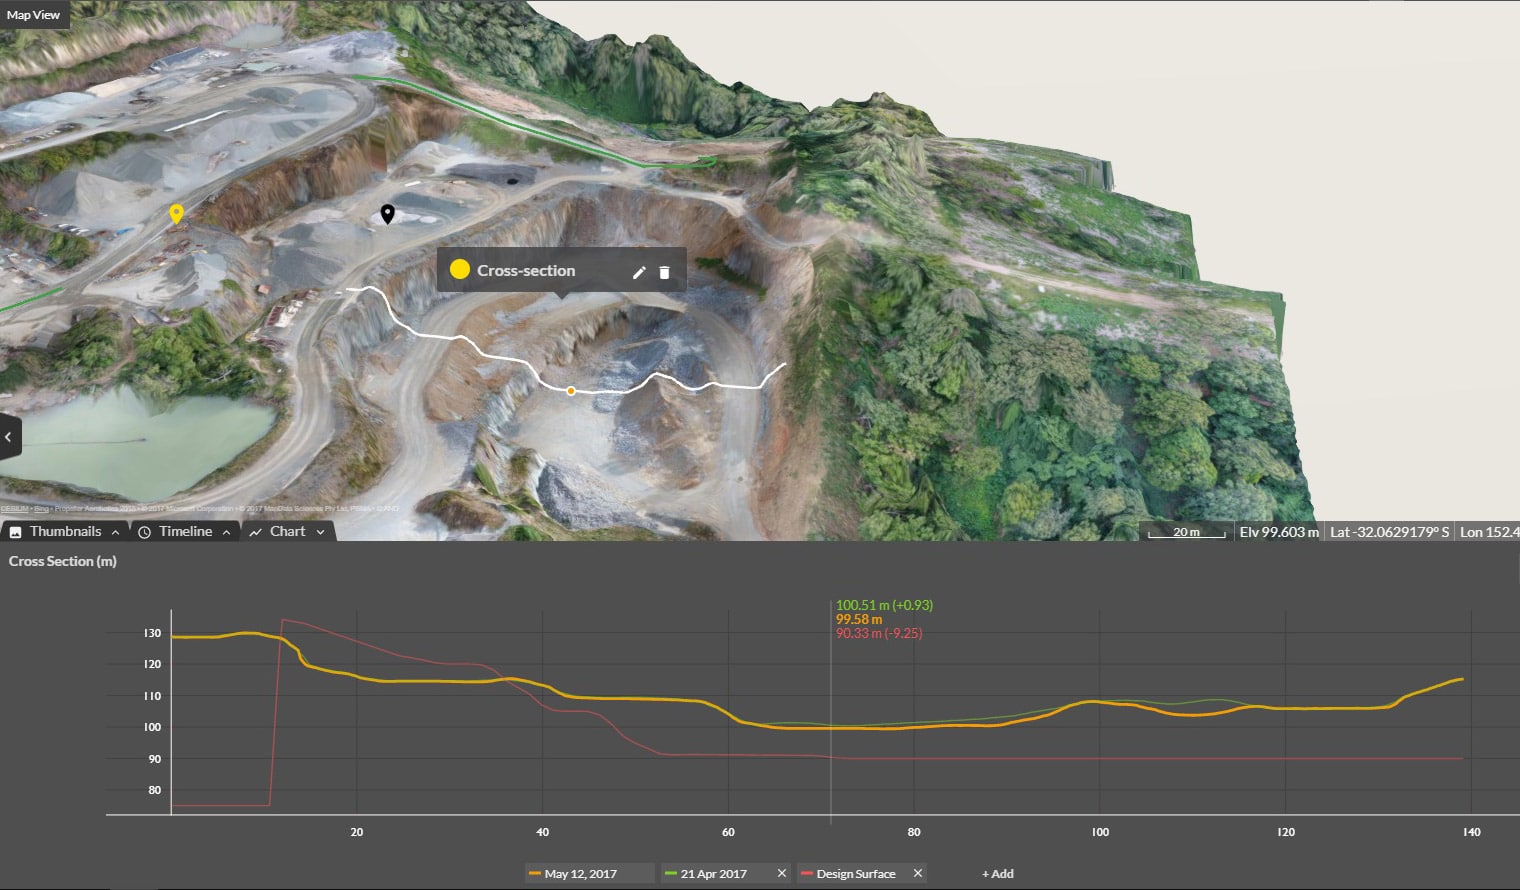
They can also be used to help settle data discrepancies. If, for instance, there’s disagreement over how much material was moved during a certain time-frame, you can use the Propeller Platform to consult a visual historical record of your site—and each survey’s processing report to guarantee its accuracy.
How to read your processing report
In order to tap into the value of your processing report, you need to know how to decipher it. Below, we’ll run down what’s in our processing reports and what that data means to you.
Note: You can view each flight’s processing report right in the platform or export a .PDF version for easy printing and sharing. Of course, the .PDF version lacks some of the dynamic functionality, such as the ability to see individual photo geotags or areas of your survey that were affected by filters.
Details
At the top of your report is a box summarizing some of your flight basics. It’s a snapshot of the survey metadata designed to quickly orient you and let you know you’re in the right place. Details in this section include:
- Capture date
- Who uploaded the dataset
- Coordinate system used
- Any smart terrain filters that were applied
- The AeroPoints used (if applicable)
- How the geotags we processed (such as through the Propeller PPK workflow
- The number of source photos

Overview
Next is the orthophoto created from your survey with the location of each ground control point (GCP) marked.
By clicking on the icons, you can view its precise x, y, and z coordinates; whether it was used as a GCP or a checkpoint in that particular survey; and whether the GCP data was validated. The same information (except the location data) is available directly below the image, as well.

Without accurate ground control, survey data is essentially useless. Being able to prove that GCP data was validated is critical for surveying professionals who stake their work on the accuracy of our data—which is less than 1/10ft (3cm) when GCPs are used optimally.
In this Propeller Platform version of our processing report, you can also choose to view areas that have been filtered out of your survey, as well as the location of your drone when every image was taken.


Image Quality
The information in this simple-to-read graph lets you assess, at a glance, whether there are image quality issues with your survey. The graph shows how many photos met our image quality standards, according to the photo metadata. Any photo with an image quality score below .8 is considered low-quality by our standards. Anything below .4 we consider unusable.

Below the graph, we provide additional information to help you decipher the information and assess the usability of the data. This information includes:
- A recap of the percentage of usable images
- Potential reasons for low-quality images (such as motion blur)
- How far in each direction images had to be shifted to align with each ground control point.
Ground Control
The last two sections detail the effectiveness of your ground control. The first, “Expected Ground Control Accuracy,” lists each GCP used along with the distance in each direction we had to shift its coordinates to fit the drone photos.

The second section, “Ground Control Summary,” lists those GCP coordinates in easting and northing, as well as the elevation difference between their submitted coordinates and the final Digital Elevation Model (DEM).
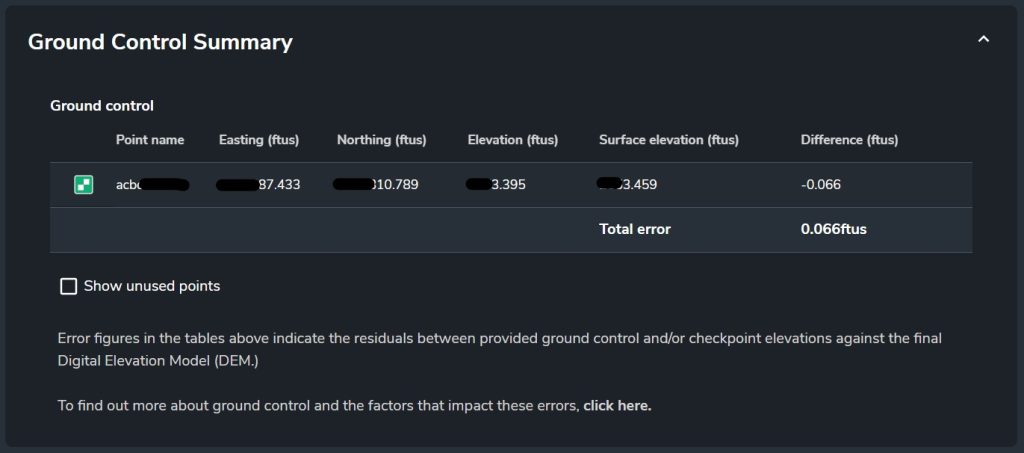
This information should be used to assess your ground control strategy and make improvements where possible. If you notice that one GCP in particular needed to be shifted more than the others, that could indicate poor placement. Try moving it to an area with a flatter surface or one less obstructed by foliage or shadows.
If multiple or all of your GCPs had noticeable deviations, there might be a larger issue at play—or you just might need more GCPs to get appropriately accurate measurements for that site.
On each of these tables, you can also choose to view your unused GCPs so you can use them as checkpoints to help validate the survey.
Say goodbye to the “black box” of drone data processing
To ensure your projects and sites run smoothly, you need total visibility into your drone data processing–even if you aren’t the one doing the processing . That’s why Propeller is so passionate about providing transparency into how we take your photogrammetry data and provide accurate, actionable surveys of your site.