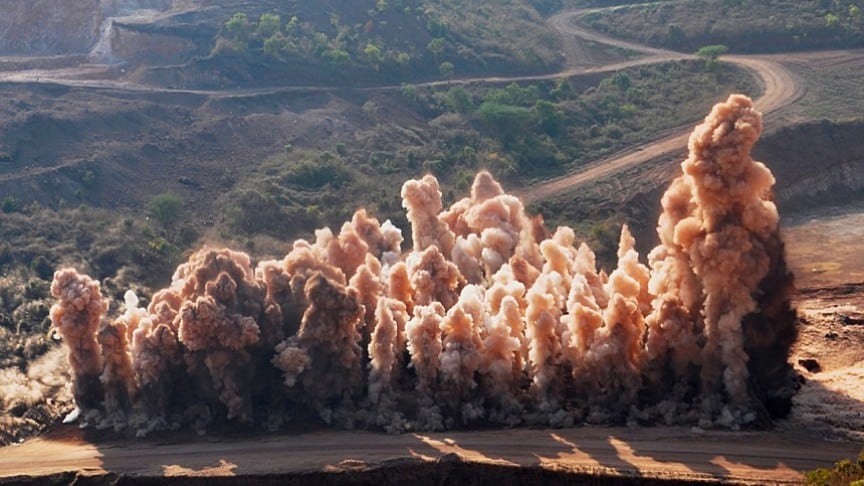
Photogrammetry is the science of collecting physical information from 2D photos, often aerial images captured by drones. In it’s most simple form, think of this as drones image processing.
By combining enough overlapping images of the same features, photogrammetry software can be used to generate photorealistic 3D representations of topographic surfaces.
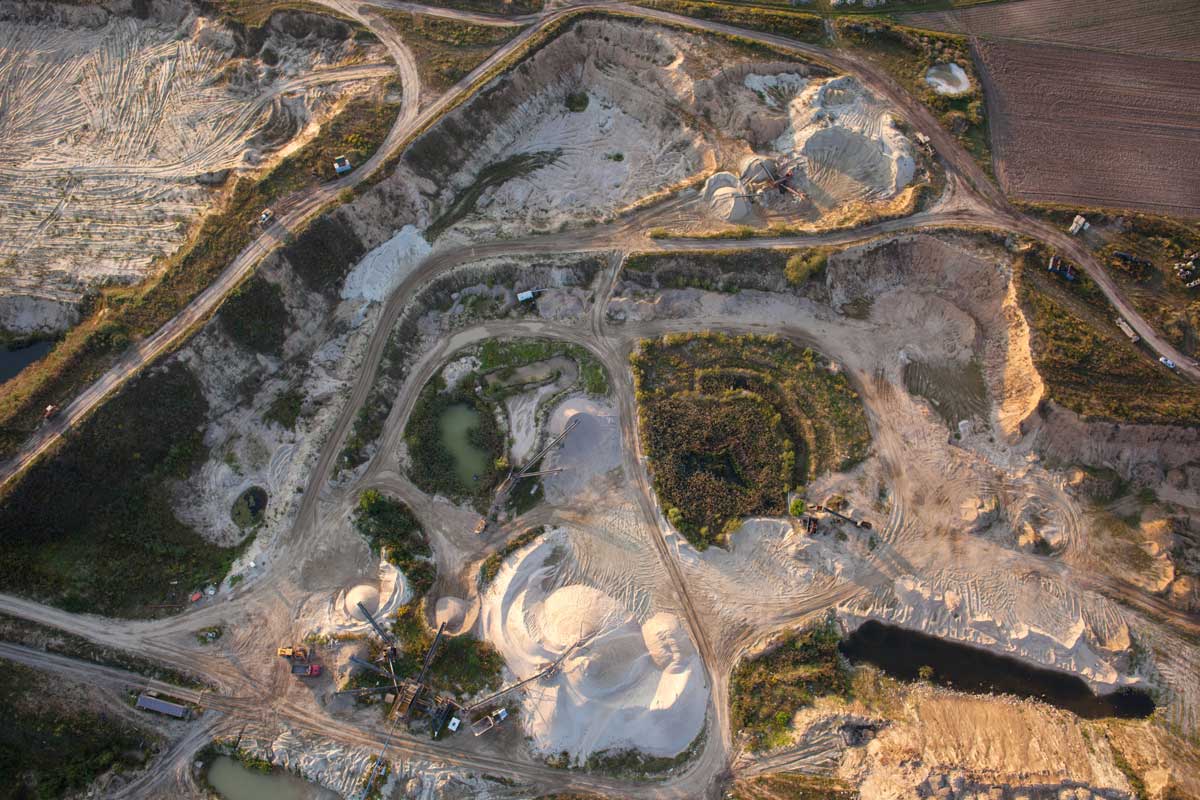
Surveying and GIS professionals use drone photogrammetry, along with accurate GPS data, to create 3D maps and models for use in construction, waste management, mining and mining workflows.
The process used to transform two-dimensional drone images into 3D models for analysis in the Propeller Platform can seem mysterious. Even longtime customers who’ve been flying for years are sometimes hazy on the finer points of photogrammetry. While drone mapping may seem like thoroughly modern science, the concept of creating maps from composites of photos dates back to the 19th century.
In this post, we’ll demystify the science that helps us deliver drone data success for earthwork operations around the world. Producing accurate 3D drone surveys requires only three ingredients: aerial drone imagery, good ground control, and the science of photogrammetry.
We’ll focus on photogrammetry in this post. Check out our blogs on ground control basics and the secrets to capturing quality data to learn more about the art and science of 3D modeling.

What is drone photogrammetry?
At its most basic, “photogrammetry” is simply “drone image processing.” Or, the science of measuring real-life distances from photos. And not just some photos—a LOT of photos. More photos than you probably think are necessary. Think of your parents taking pictures of you and your date before prom. More photos equal higher accuracy, and you need every angle possible.

More specifically, there are four ingredients necessary to generate accurate 3D models:
- Optimal height: Drones need to fly at an optimal altitude to achieve the best ground sample distance.
- 80% image overlap: The computer needs enough information to stitch images together into an orthophoto—a 2D aerial image corrected for distortion.
- Angles: A wide variety of angles is required to create a digital terrain model, or a 3D look at the shape of your terrain surface.
- Steady flight: Getting high-quality photos for drone photogrammetry requires a steady, consistent drone flight to capture clear images. (Check out our Surveyor’s Guide to Drones blog series for tips on how best to do this.)
Combined, orthophotos and digital terrain models (also called DTMs) create the 3D models of your site.
How does drone photogrammetry work?
Drone Aerial Photogrammetry uses multiple views of the same feature, or a visually distinct point in an image, to triangulate its x, y, and z coordinates in space. The more features you match between images, the better you can relate images to each other and reconstruct objects within them.
How photogrammetry enables 3D drone mapping
A drone takes hundreds or even thousands of overlapping aerial photos as it flies over a worksite. Those images are then processed and analyzed using photogrammetry to measure the geography and landscape features of the site. When you combine enough overlapping images of the same features, photogrammetry software can generate photorealistic 3D representations of topographic surfaces and features.
Simply put, the high resolution camera mounted on the drone captures the images, and the photogrammetry software combines those images to create a highly accurate 3D map.
If you took an average image from a survey, you’d easily be able to pick out many “features” between different photos. The more features you match in 3D drone mapping, the better you can relate images to one another and reconstruct the objects captured in them.
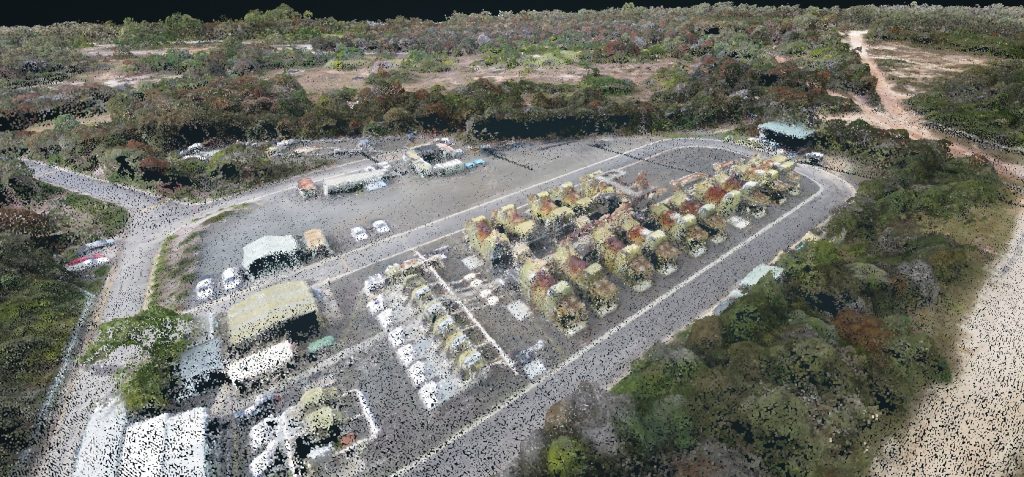
With literally millions of these features, you can create what’s known as a point cloud, or a three-dimensional set of points, each representing a matched feature to describe your surveyed area to the computer. You can then turn the point cloud into any regular output used in geospatial software, such as 3D mesh or a digital elevation model.
Photogrammetry in real life
If you’re having trouble visualizing how this all works, you can use your eyes—literally. Eyeballs use photogrammetry all the time to create the images you see.
Think of your eyes like two cameras, constantly processing a live feed of your surroundings. Your eyes are spaced to provide two inputs at slightly different angles. You can test this yourself by holding up a finger in front of your face. Look at it with one eye closed, then the other. You’ll notice that your finger “jumps” in space relative to background objects.
Because your brain knows how far apart your eyes are, it can process the information it receives into accurate geospatial data by merging both feeds into a single perspective. This is often called depth perception. You can test this process, too—try to catch a ball with one eye closed. You’ll notice it’s much more difficult.
Your brain renders a live map of the three-dimensional world based on two-dimensional inputs in the same way the Propeller Platform renders a 3D survey from 2D photos.
What drone data is used in photogrammetry?
Contractors in the construction industry reap many benefits from the data gathered through drone surveying. With the 3D imagery, highly accurate maps, and elevation data they obtain, companies can monitor project progress and easily inspect all or part of their work sites. The accuracy of the 3D models also means they can be used to calculate distance, area, and volume measurements.
“The system checks these geotagged images against known points on the ground, then processes them with software like the Propeller Platform using advanced drones image processing techniques to create highly detailed, accurate 3D models. To ensure the best model from 3D drone mapping data, aim for a 60 to 70 percent overlap between each aerial photo. This improves triangulation accuracy and helps track the same points between images.
How does photogrammetry software work?
Point clouds outline the shapes of features on a worksite, but to get a photorealistic digital surface model, you need to match those shapes with visuals. This is where image stitching, or ortho-rectification, comes in. The computer looks for common features shared by multiple images captured in the same location to fit images together and combine them with the point cloud. Compare the idea to a very advanced jigsaw puzzle.
This process works well on most surfaces, but there are limitations to the computer’s ability to recognize patterns. If a surface is too featureless or turbulent, like the polished windows of a building or the churning waves of the ocean, stitching doesn’t work very well. You can’t match a feature between images if it’s there in one photo and gone in the next, or if every feature looks the same as every other.
Curious how photogrammetry compares to lidar? Check out this post for a side-by-side comparison.
Seeing the big picture
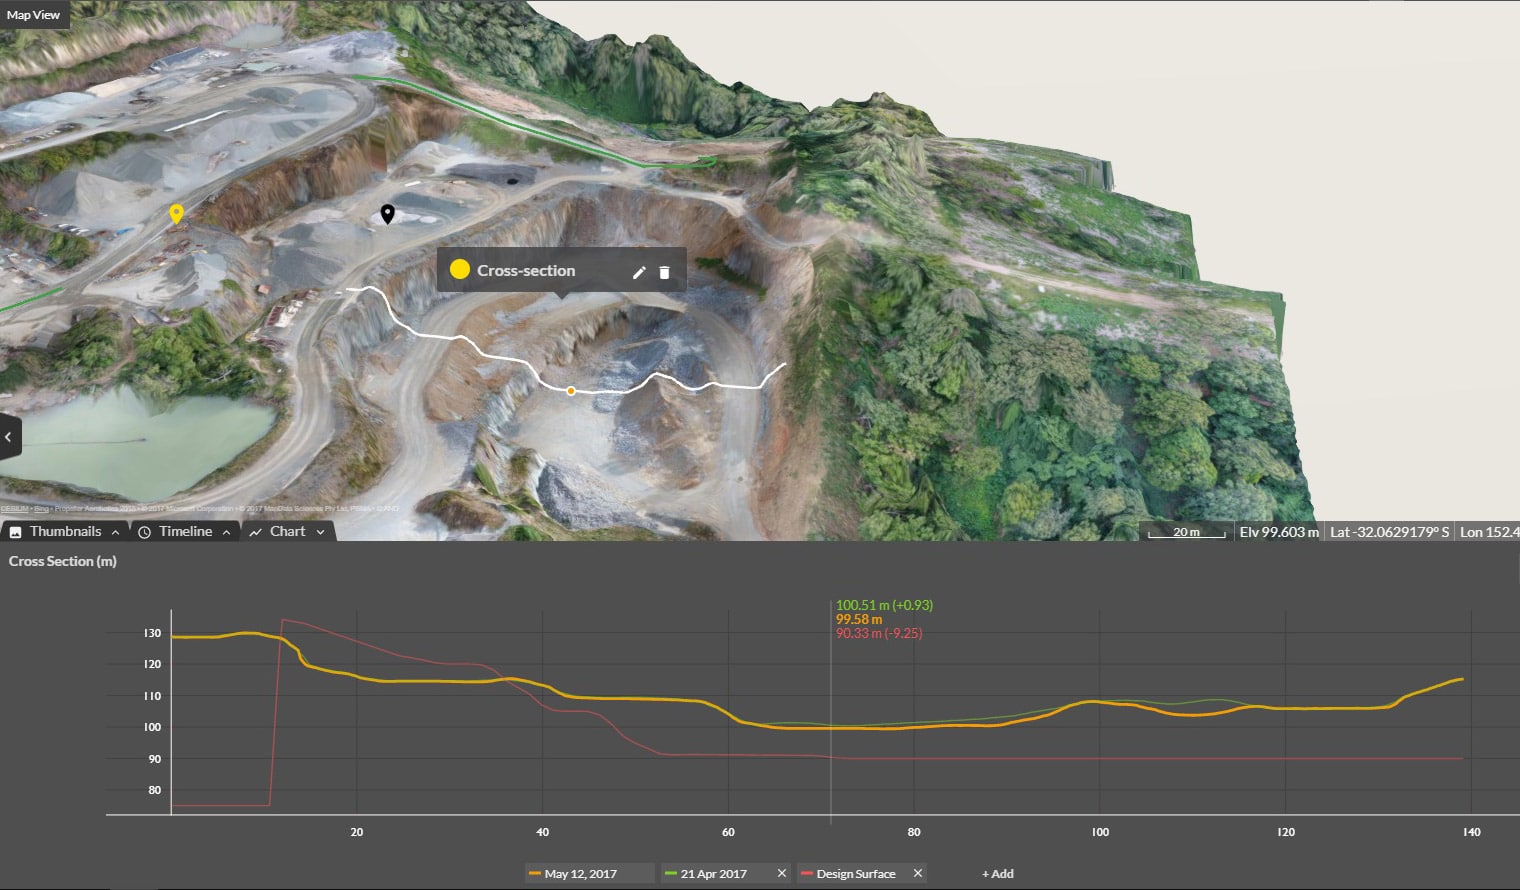
So now you’ve got your point cloud—the source of “terrain” outputs like DXF mesh, geoTIFFs, etc.—and an orthomosaic to give those points visual meaning. The system layers the orthomosaic over the elevation model to produce a final, measurable 3D model of your worksite.
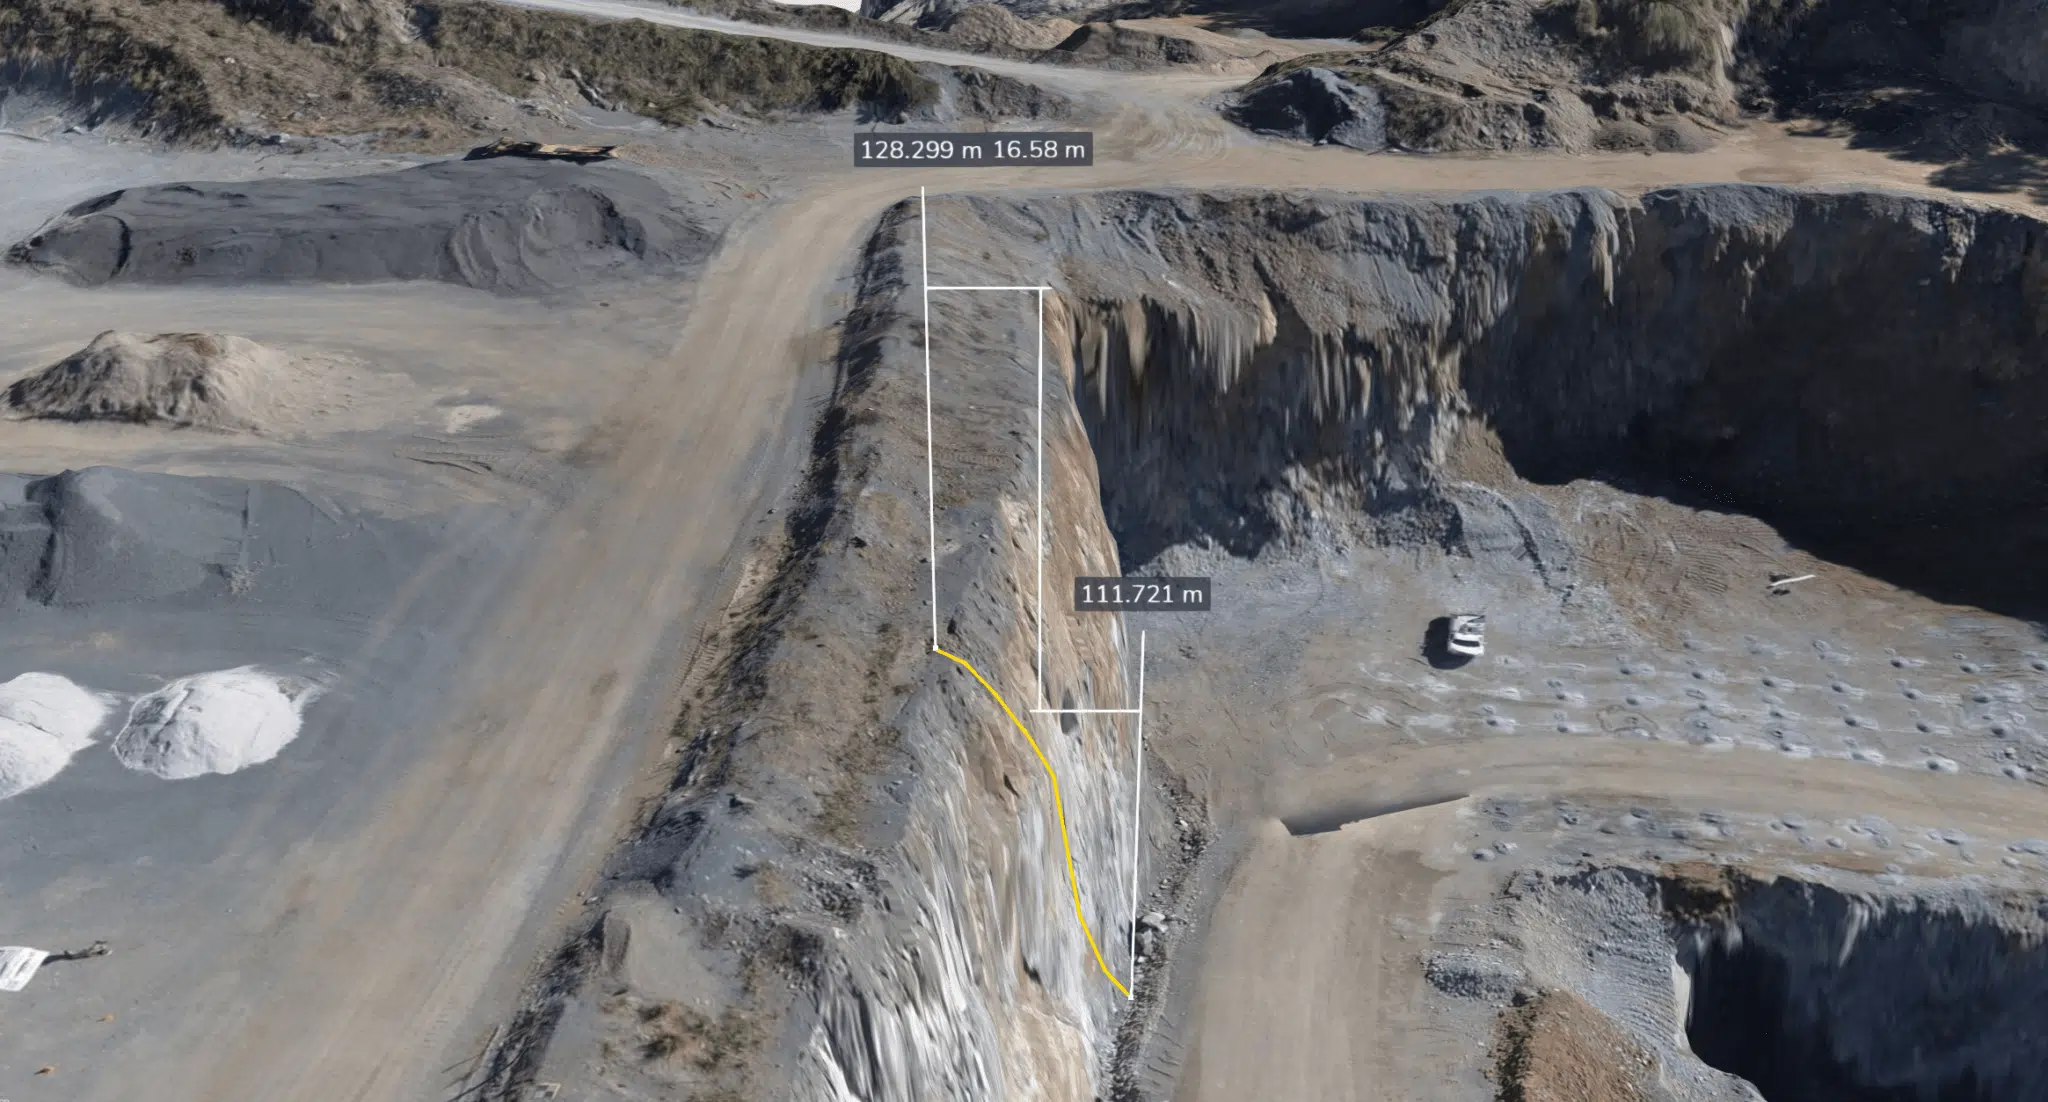
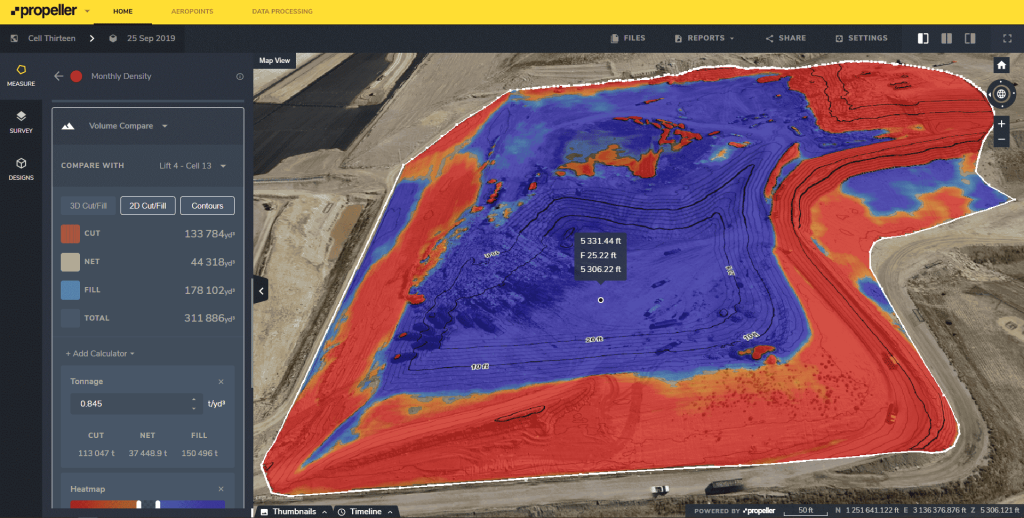
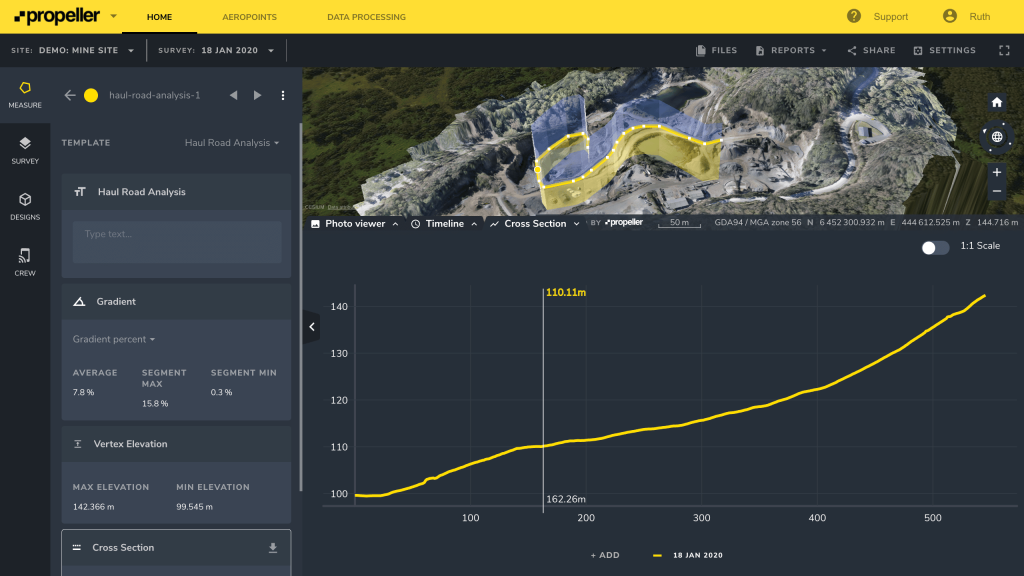
From there, you can use the industry-specific measurement tools in the Propeller Platform to calculate stockpile volumes, determine cut/fill quantities, monitor haul road grades, track progress against design, and much more. You can also export your data for use in other GIS or CAD software, if you prefer.
However and wherever you intend to use your drone data, photogrammetry will get you faster, more accurate information than traditional surveying methods alone.
3D mapping with propeller
Choosing the right drone for mapping
Drone mapping software enables construction sites, quarries, mines, and landfills to map and survey large areas of land using a drone. But before you can start mapping, consider what type of drone will work best for your needs. Quadcopter drones are a popular choice due to their portability, ease of use, and accessibility. Drones like DJI’s Phantom 4 RTK and Mavic 3 Enterprise feature high-quality cameras that are well-suited for mapping worksites.
The mapping process
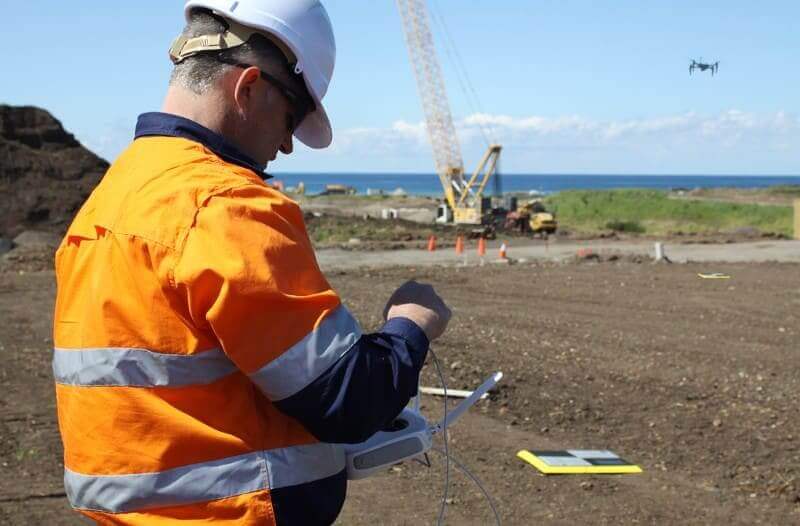
So how does the mapping process work? First, you fly your drone over the worksite to capture overlapping aerial photos of the terrain. Ground-level correction is necessary for accurate drone mapping because GPS location accuracy alone is only within two to five meters. To address this, place ground control points (GCPs) on your site before flying the drone. GCPs are fixed points on the ground that the drone captures during aerial mapping sessions. Smart GCPs, like Propeller’s AeroPoints, wirelessly upload ground control data to data processing software, establishing a “source of ground truth” for the survey.
Choosing the right mapping software
Next, choose the appropriate drone mapping software. Ideally, it should offer an end-to-end solution that covers survey planning, data processing, site measurements, and overall data management.
Creating a 3D model
A solution like Propeller uses photogrammetry to combine the overlapping aerial images from the drone flight to generate a photorealistic 3D representation of the topographic surfaces of the worksite. Project teams can then use this 3D map to accurately calculate area, volume, slope, and many other measurements–up to 1/10th of a foot (3 cm).
Collaborating with project teams
Surveyors and engineers aren’t the only ones who use these maps. The 3D map serves as a digital meeting ground for all project stakeholders, both internal and external. Its simplicity allows the whole project team to view the site from different perspectives, identify potential hazards or opportunities to improve efficiencies, and make informed decisions based on highly accurate project data.
Reducing disputes and increasing connectivity
Because everyone’s looking at the same map, disputes are less likely to arise, fostering greater trust with customers and reducing the potential for rework. Propeller also ensures that field teams have access to updated maps and reports in the palm of their hands from mobile devices, keeping the office and field well connected.