Several years ago, point clouds required trained professionals and expensive software to interpret and analyze. Those old-school point clouds were sparse and required expert knowledge to read accurately—and you could forget about seeing a photorealistic 3D map of your worksite.
But modern point clouds aren’t complicated or scary, and they don’t require an advanced degree to use on your site surveys.
Remember those Magic Eye images from the 90s? At first glance, they looked like visual static—a collection of randomly assembled dots on a page. But if you knew how to look at them just right, they’d resolve into a three-dimensional image. Point clouds work in much the same way, except that computer imagery lets us see them in 3D without squinting.
Today, drone surveying has made 3D point clouds more accessible and easier to use than ever before.
What are point clouds?
For the visual learners out there, let’s start with a tasty example. Imagine that you’re making donuts and dipping them in powdered sugar. Now imagine that each grain of sugar has very specific geocoordinates to tell us where that grain is located in space.
Although the sugar coating has no inherent shape of its own, because it’s sitting on the surface of an object (in this case, a donut), we can use it to outline or “read” the terrain underneath.
Point clouds are like the powdered sugar in this example. They’re a collection of thousands or millions of points, all with hyper-specific coordinates to tell us where each point belongs in space. When we read these coordinates all together, they assemble to create an accurate map of a site’s topography.
Point clouds are used to measure an object’s depth, elevation, shape, and exact geolocation. Every point cloud is essentially a data-based representation of a physical space, so each one is as unique as the terrain it’s being used to measure.
Historically, GIS specialists, engineers, and surveyors created point clouds using pulses of laser light (LiDAR). Instruments measured the time it took for a beam of light to bounce back from an object on the ground to the sensor, providing readings on that object’s height, width, and depth.
Over time, collection mechanisms expanded to include UAVs and drone photogrammetry. Today, photogrammetry is a much more cost-effective and efficient way to generate point clouds on most worksites.
Photogrammetry vs. LiDAR
Drone photogrammetry takes a different approach to data collection than LiDAR. Instead of bouncing beams of light against objects on the ground, drones capture high-resolution aerial photos. During flight, the drone captures thousands or millions of photos—enough that distinct features overlap in multiple images.
The location of each feature can then be measured using triangulation. When a point is captured in two images with known positions, we can establish coordinates for the third point. The more features included in a set of drone images, the denser the point cloud (and the more accurate the data).

Photogrammetry is the science of measuring real-world objects using geotagged images. Think of photogrammetry as a mathematical equation. Point clouds are the values we plug into that equation to create a final survey output—in this case, a 3D map.
So what’s the relationship between point clouds and 3D modeling? Well, you can’t build an accurate 3D site model without a point cloud.
There are two ways to generate point clouds: LiDAR and photogrammetry. Of the two, photogrammetry is more accurate and cost-effective for all but the densest vegetation. (Sites with heavy vegetation benefit from LiDAR, as long as light beams can penetrate the leaf cover.)
One significant benefit of photogrammetry is that the final maps are photorealistic. Because the data comes from images, maps reflect the actual terrain. LiDAR point clouds are typically sparse and lack color or use a simple RGB color scheme. It’s much easier to read a photorealistic map than a dense mass of points.
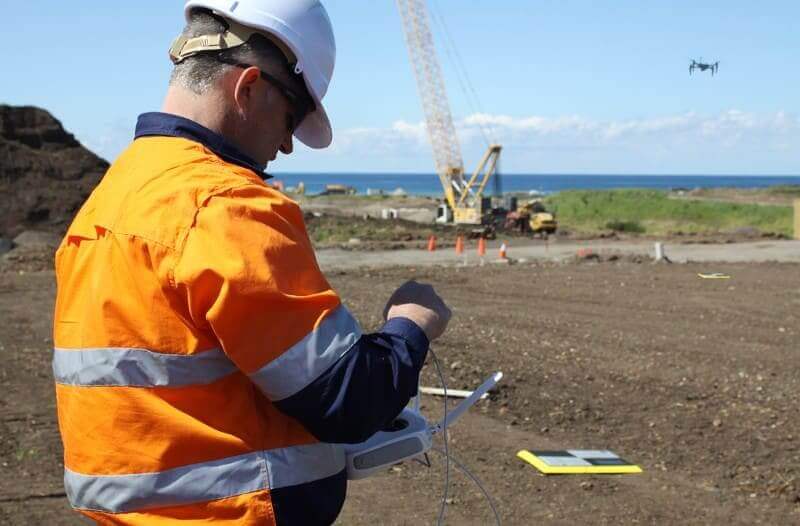
Hardware and software cost less with photogrammetry, and the data is easier to process after the fact. It takes less than an hour of training to achieve proficiency in drone photogrammetry, and you can still generate point clouds accurate enough for 99% of earthwork applications.
Check out this post to learn more about the differences between LiDAR and photogrammetry, including which method is best for your worksite.
How Propeller uses point clouds
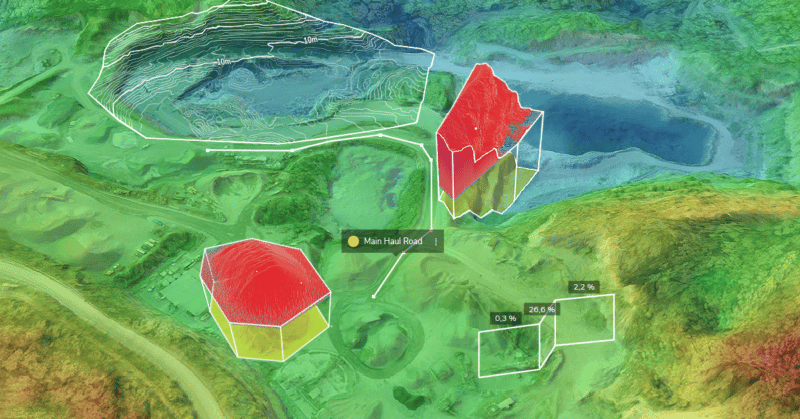
You won’t encounter point clouds much on the Propeller Platform. That’s because we handle the data processing for you, so all you see is the final output: an accurate, realistic 3D map of your site.
But what if you’ve already completed a survey, and you want to upload your point cloud to Propeller?
We’ve got you covered. Just upload your LAS/LAZ files into Propeller, and we’ll handle the rest.
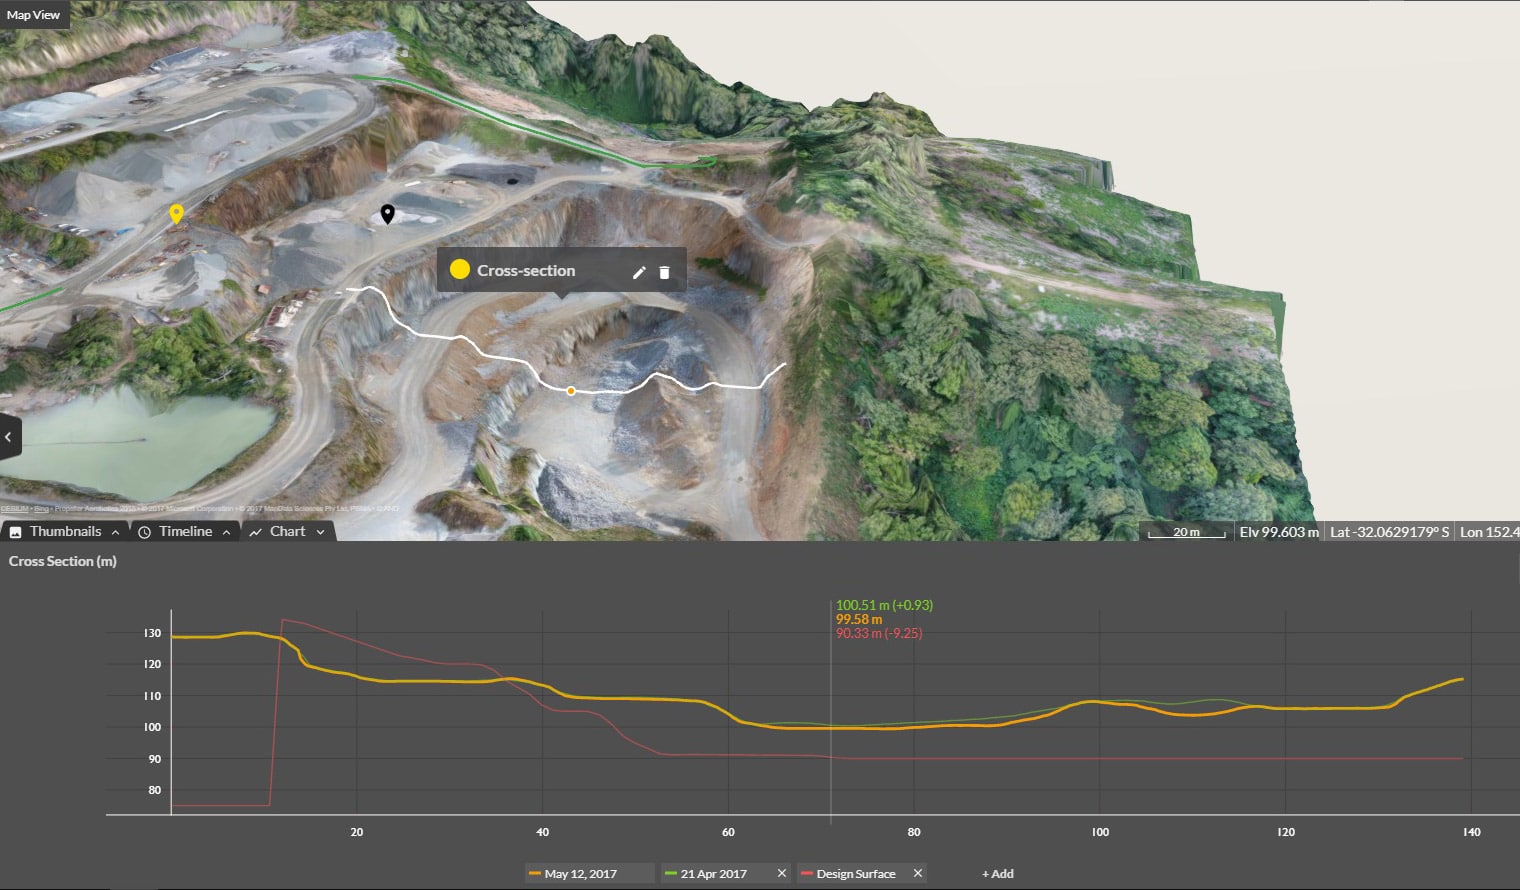
Whether you generate them natively with Propeller PPK or upload them after the fact, point clouds have a massive amount of potential. Use them to measure volumes (like stockpiles), road gradients, cut/fill, and progress against design surfaces.