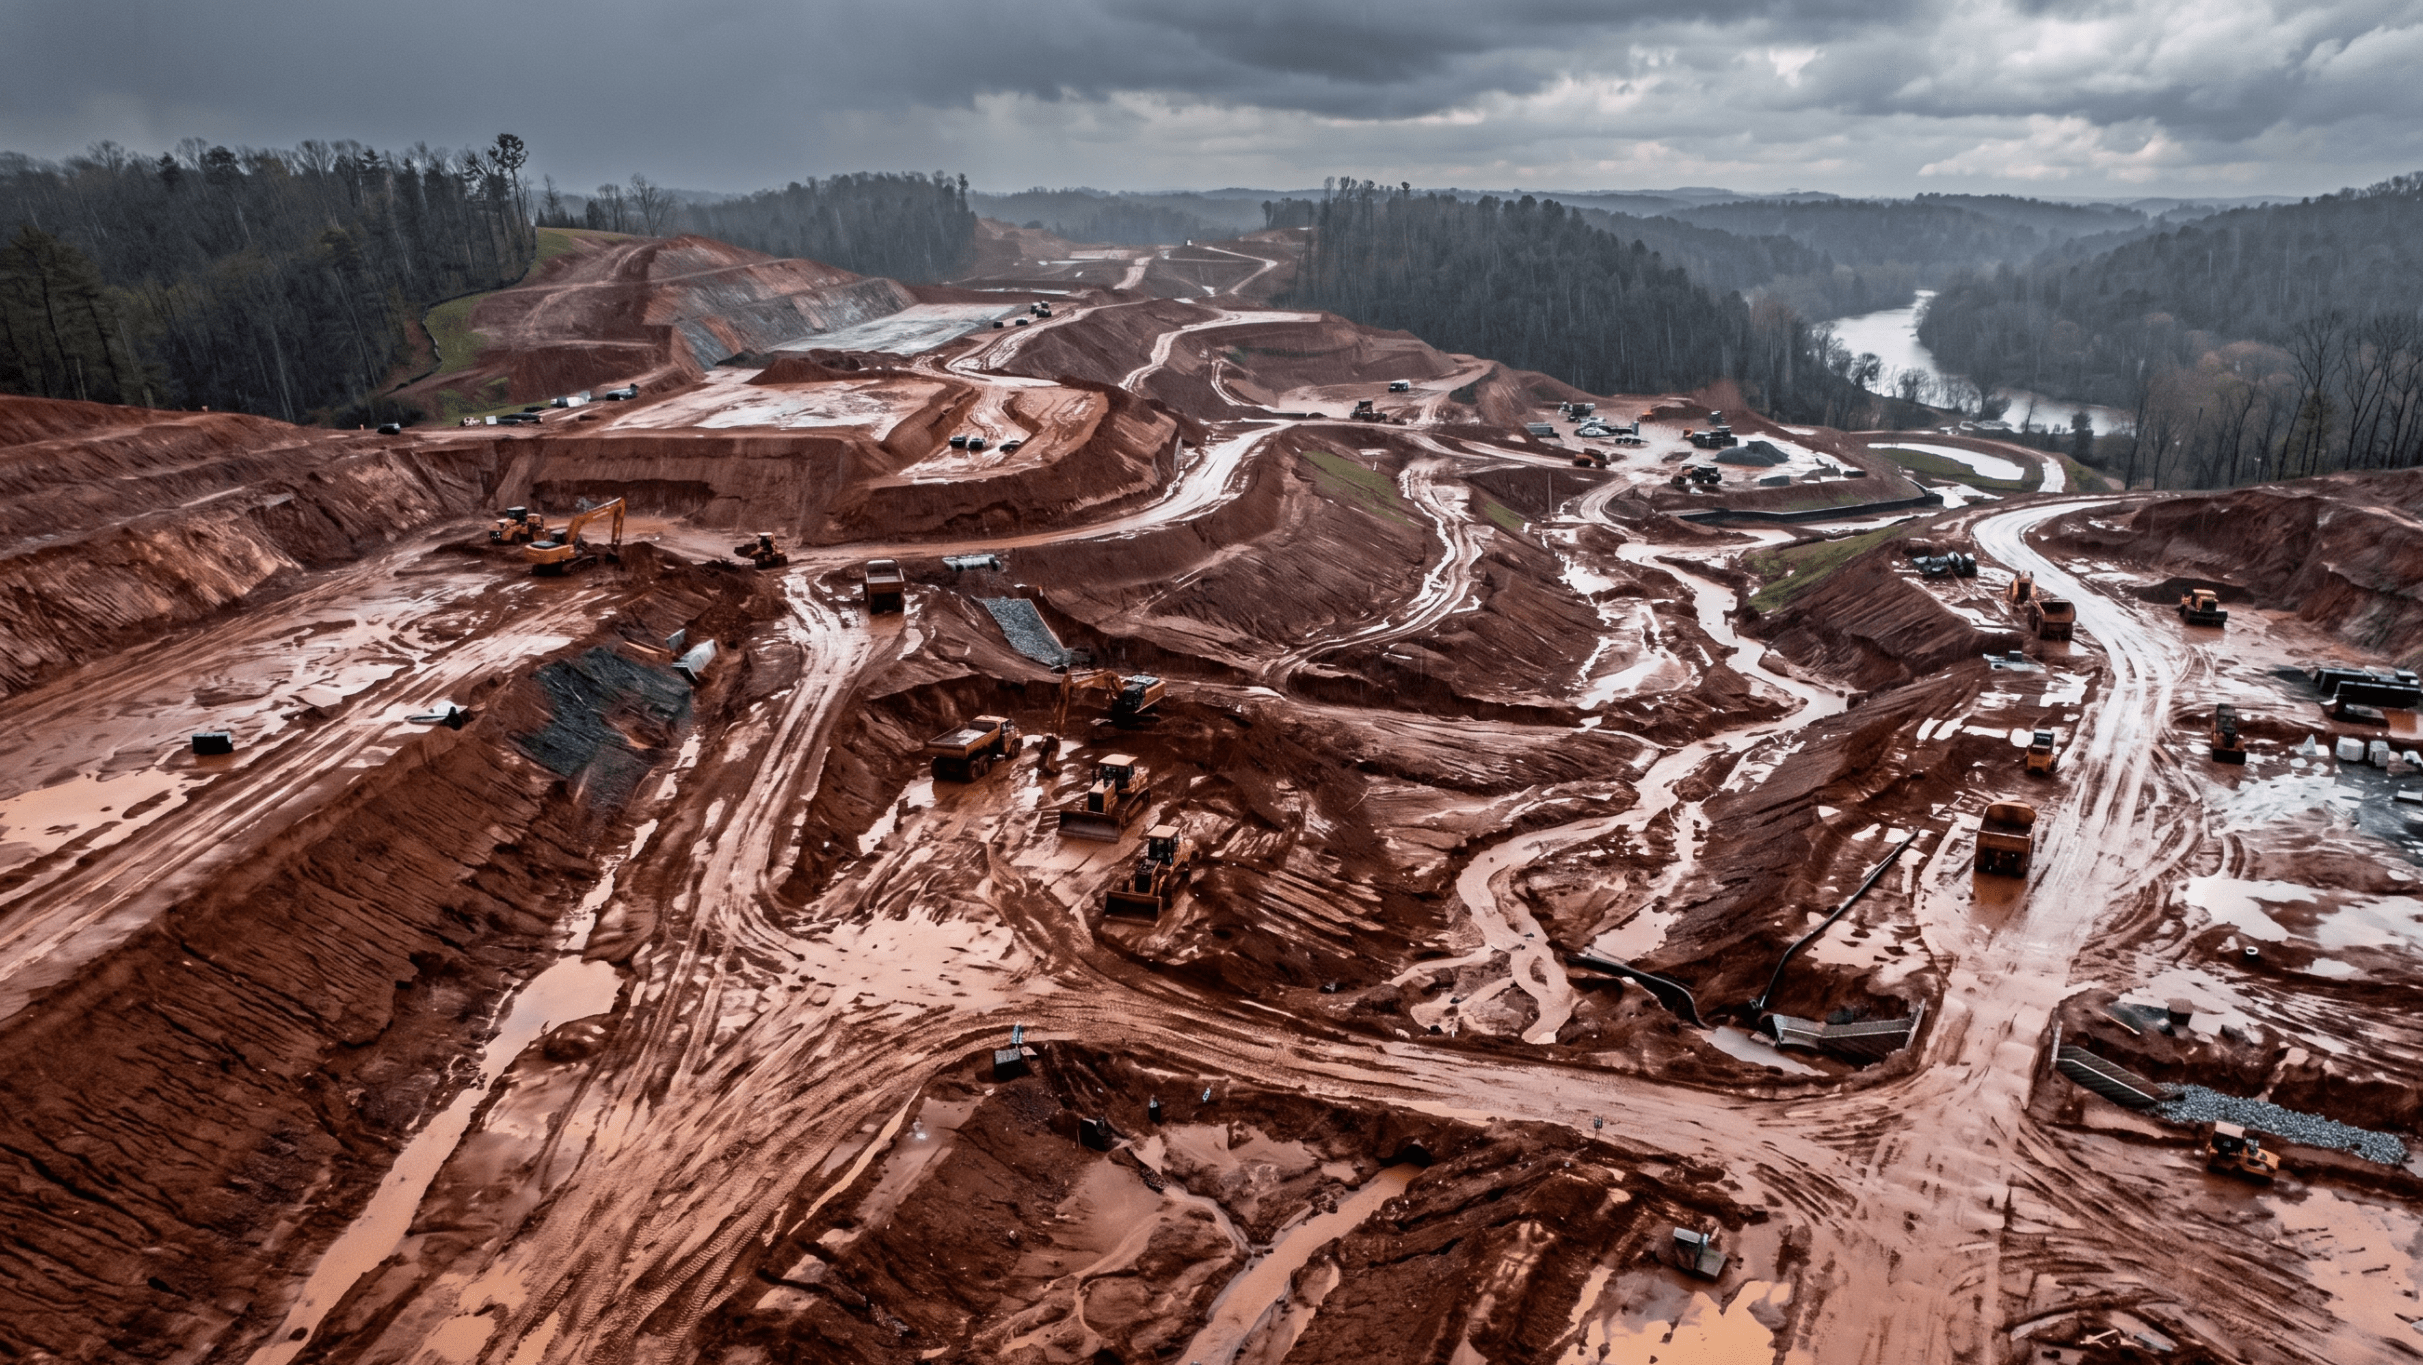
Water doesn’t follow plans. It follows gravity. And on active earthwork sites, that distinction can mean the difference between a well-managed drainage design and a very expensive surprise.
In our latest Power Hour, Propeller technical expert Shahrukh Nadeem walked through the platform’s hydrology tools: how to analyze water flow, prep your terrain for accurate modeling, and navigate some of the latest platform updates. It’s a session worth bookmarking if drainage is anywhere near your list of site headaches.
Missed it live? Watch the full recording on YouTube.
What’s new in the platform
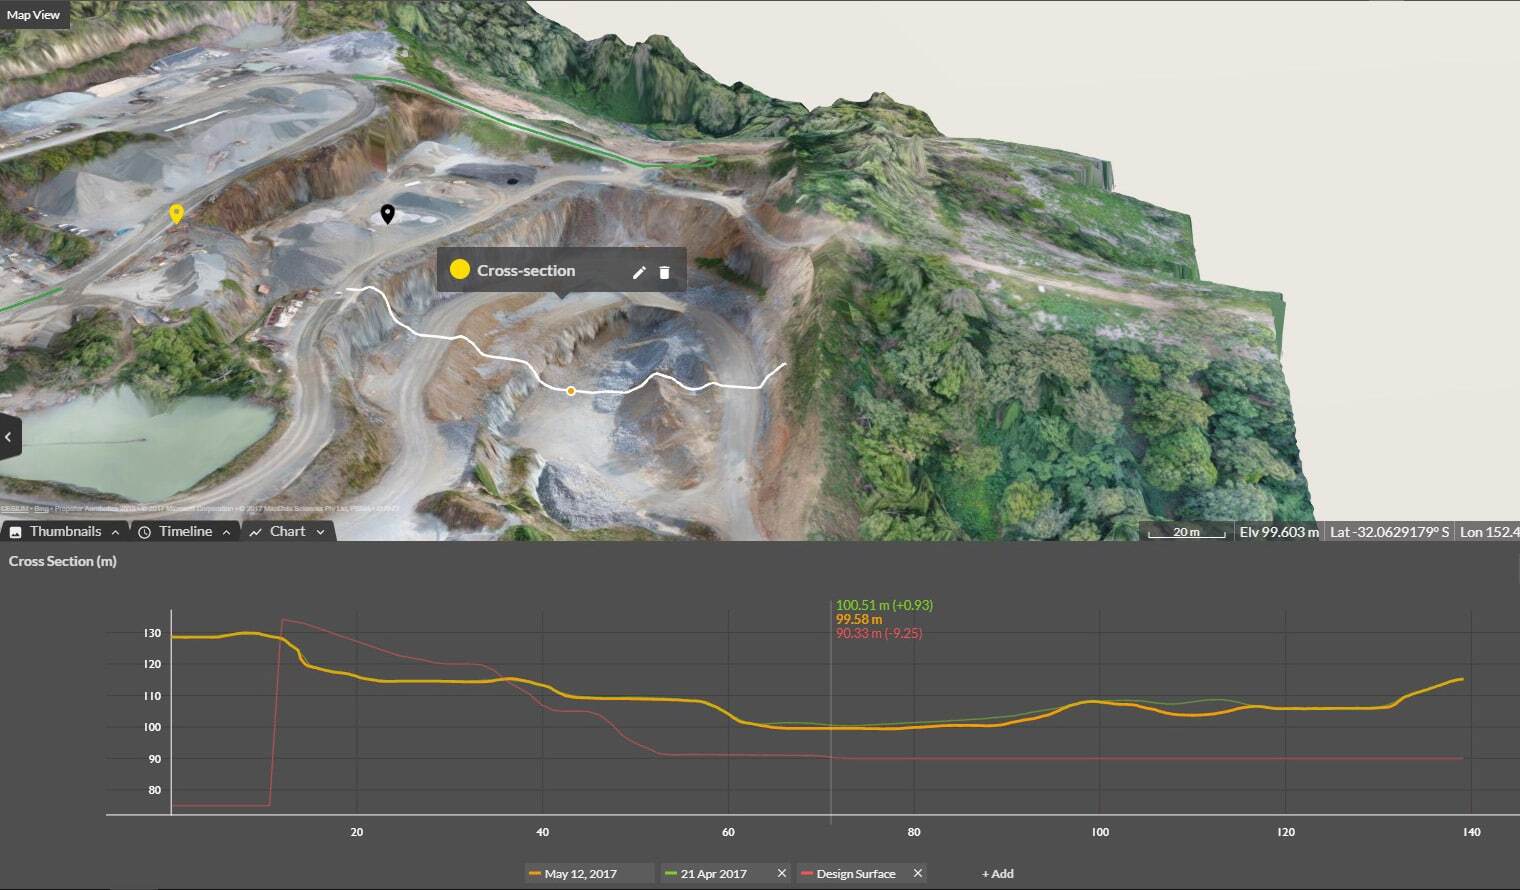
Before getting into the hydrology tools, Shahrukh ran through a few UI changes worth knowing about. The top control bar has moved to the bottom left, which consolidates your settings, help resources, and data processing status all in one spot. The goal? More screen space for the map itself. “We’ve made some adjustments so that we can maximize the amount of screen space given to the map and the model,” Shahrukh explained.
The upload button stays top right: same workflow, cleaner view.
The session also introduced target folders. Set any folder as your active destination and every measurement you take from that point automatically saves into it. It sounds small, but on a busy site with multiple people capturing data, it adds up fast. Worth noting: the folder itself is visible to everyone on the project, but the target folder setting is personal and each user sets their own for the session.
The hydrology tools, one by one
Flood to level
The simplest of the four tools. Click a point on the map and Propeller draws a contour showing what a flood at that elevation would look like across your site. You can type in a specific RL instead of picking from the map, and export the boundary as a DXF if you need it in third-party software.
Simple, but handy, especially when you’re trying to quickly communicate flood risk to someone who hasn’t spent much time in a 3D model.
Surface runoff
This one gives you the broad picture of how water moves across your site: which direction it flows, where it crosses haul roads, where it’s likely to cause channelization or rutting over time. Turn on the animation and the flow direction becomes immediately readable.
Shahrukh used a haul road embankment as a live example. Water was flowing down the top embankment, crossing the road transversely, and continuing down the other side. “You might expect rutting to form, channelization, which will obviously damage the road and potentially be a hazard to vehicles,” he noted. The fix isn’t complicated once you can see it: regrade the road with a crossfall toward the inside edge, add a drainage channel, and redirect the water before it does damage.
The tool also includes a liquid drop analysis, a localized version where you drop a point on the map and simulate where a spill or leak from that exact location would travel. Shahrukh’s example was a temporary diesel tank. “If this was where we had a temporary diesel tank and this is where we would have an oil spill, this would let me make better decisions about how I might create my bunding and what fuel containment measures I might want to install.”
Catchment and watershed analysis
This is where things get genuinely useful for drainage planning. Rather than showing general flow direction, the catchment tool lets you select any outflow point and instantly see the entire upstream area that drains toward it, along with the horizontal catchment area in square meters.
That number does real work. Pair it with expected rainfall intensity and you’ve got a volume figure to design against. “If you have this area and then you also have the millimeters of rain that you might expect for a certain rain event, combine the two, you basically have a volume of water,” Shahrukh explained. “That can really assist you in designing for pumps and sumps and drainage ponds.”
The residential subdivision demo made the value of this tool pretty concrete. The team needed to prevent any water from flowing onto an adjacent property they didn’t own. Using the catchment analysis, they identified two ingress points along the site boundary and quickly worked out that a single drainage pond could capture nearly three-quarters of the site’s runoff. A short connecting channel between the two stream networks handled the rest, and no second pond was needed. “Just by having things visualized, we can basically avoid having to double up on the kind of infrastructure we might need.”
Direct rainfall simulation
The most comprehensive tool in the set. Upload a CSV with duration and rainfall intensity data from a meteorology source, and Propeller simulates how that rain event moves across your surface over time. Scrub through the timeline to see where water accumulates, where low points become risk areas, and where embankments might get overtopped before the event peaks.
In the landfill demo, the simulation flagged a causeway where water was building up. The drone survey hadn’t captured the culvert beneath it, so the model was treating it like a solid wall. Shahrukh showed how the terrain cleanup tool can carve out an artificial channel through the causeway to better represent what’s actually there, then rerun the simulation for a more accurate result. The change is non-destructive and easy to disable when you’re done.
The same simulation picked up water overtopping a landfill cell embankment mid-rehabilitation. When Shahrukh zoomed into the imagery, the ruts and erosion channels were right there, exactly where the model predicted. “This is exactly what has happened at some point in the past. Water has overtopped the embankment, flowed down exactly where the simulation is showing us.” That kind of real-world confirmation is hard to argue with.
Q&A highlights
A few good ones from the live session worth pulling out:
Is hydrology available on all licenses?
Yes, both Standard and Scale Tier platform licenses include the hydrology tools.
Can you export catchment boundaries?
Flood to level outlines export as DXF. Catchment polygon export isn’t available yet, but it’s been flagged as a feature request.
Can you run this on a design surface?
Yes, if it’s uploaded as a TIN surface rather than a design file. Same analysis, same tools.
Does it account for underground drainage?
No, the analysis is surface only, based on your uploaded DEM. Pipe modeling is also on the feature request list.
Try it yourself
The hydrology tools are live in your Propeller platform now. If you want to explore with sample data, download the example hydrology dataset and follow along with the session recording.
Got questions or feature ideas? Drop them in the Community Forum or reach out to your customer success contact directly.