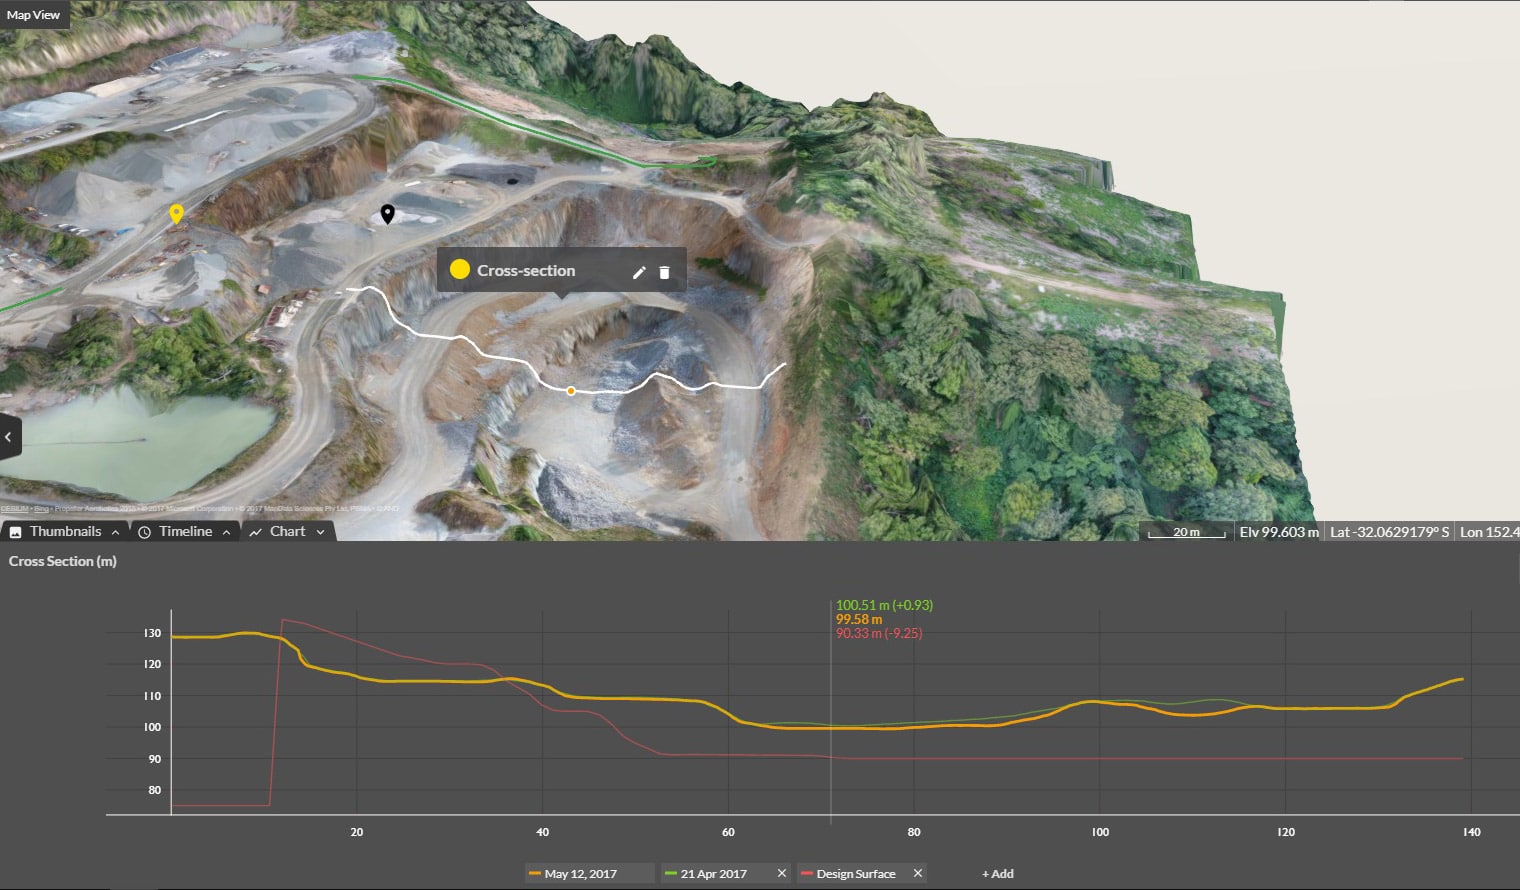
Cross Section Survey in a Matter of Minutes Using Drone Data
With the power of drone-captured data and the Propeller Platform, surveying cross sections becomes as…
Streamline construction daily reporting with automated insights and real-time field data from DirtMate and drone surveys. Propeller transforms construction teams inventory reports from tedious tasks into high-impact tools, helping you gain clarity, confidence, and control across every phase of your projects from stockpile management, to machine movement and site progress.

Construction daily reporting software helps contractors, site managers, and operations teams track site activity, production, equipment utilization, and project progress in real time.
Automated reporting tools replace manual spreadsheets and disconnected workflows by centralizing site data, drone surveys, machine tracking, and production insights into a single platform.
Streamline Construction Reporting Workflows
With Propeller, daily reporting becomes effortless. From automated data collection with DirtMate to real-time insights and customizable reports, you’ll save time and make smarter decisions every day.
Build trust and accuracy into your construction reports with real-time, data-backed insights your entire team can rely on. Whether you need stockpile tracking, production summaries, or operational reporting, Propeller delivers actionable site data that supports faster decision-making.
Get real-time visibility into site progress, operator efficiency, machine activity, and material movement directly from the field. Propeller helps construction teams reduce delays, improve reporting accuracy, and identify operational issues earlier.
Automate your reporting workflows to capture the data you need—whether it’s truck counts, progress tracking, or material movements. Generate automated site reports for civil projects instantly, tailored to your site’s unique requirements.
Monitor your site’s performance daily with tools like DirtMate and Propeller’s intuitive platform, so you can see trends, identify issues, and adjust plans as needed. With built-in construction daily reporting software, Propeller helps teams move from raw data to ready-to-use inventory reports in less time.
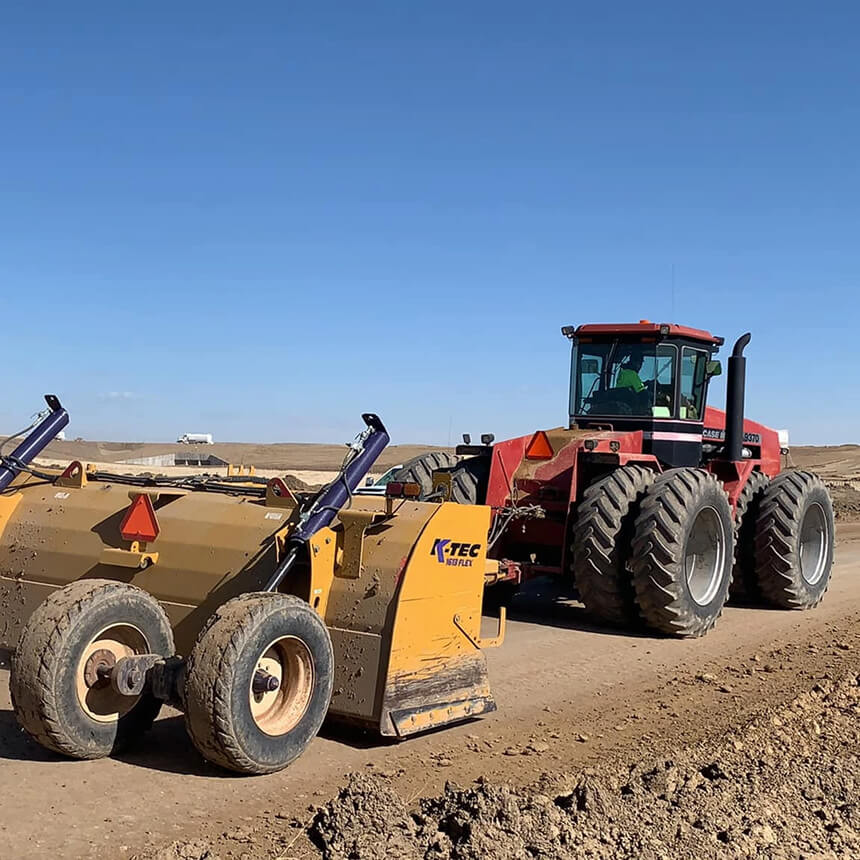
“DirtMate’s machine data and Propeller’s accurate drone surveys help us quantify earthmoving. We survey monthly or bi-weekly based on needs.”
– Thomas Loewen, Excavation Professional

Capture real-time project updates with accurate site data. Keep stakeholders informed and make data-driven decisions with confidence.
Construction teams use daily reporting software to monitor production progress, track material movement, document site conditions, and improve communication between field and office teams. Automated reporting reduces manual admin work and improves operational visibility across active projects.
Construction daily reports can include stockpile volumes, machine utilization, load counts, site imagery, production quantities, grade changes, material movement, and progress tracking data collected from drones and machine tracking systems.
Automated construction reporting improves accuracy, reduces reporting delays, and gives teams faster access to operational insights. This helps project managers identify issues earlier and make more informed decisions throughout a project lifecycle.
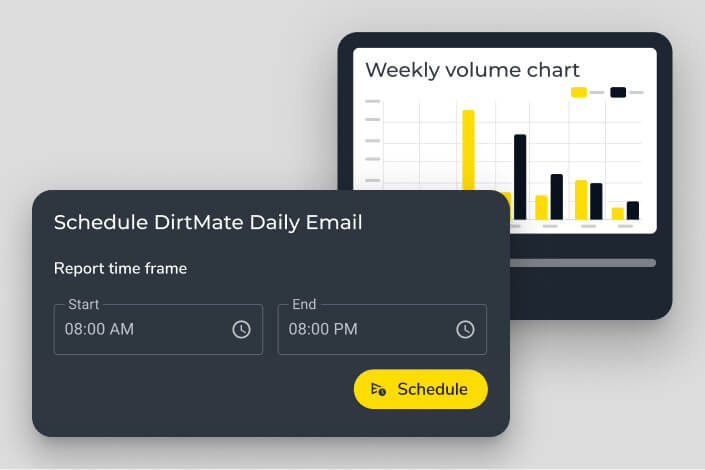
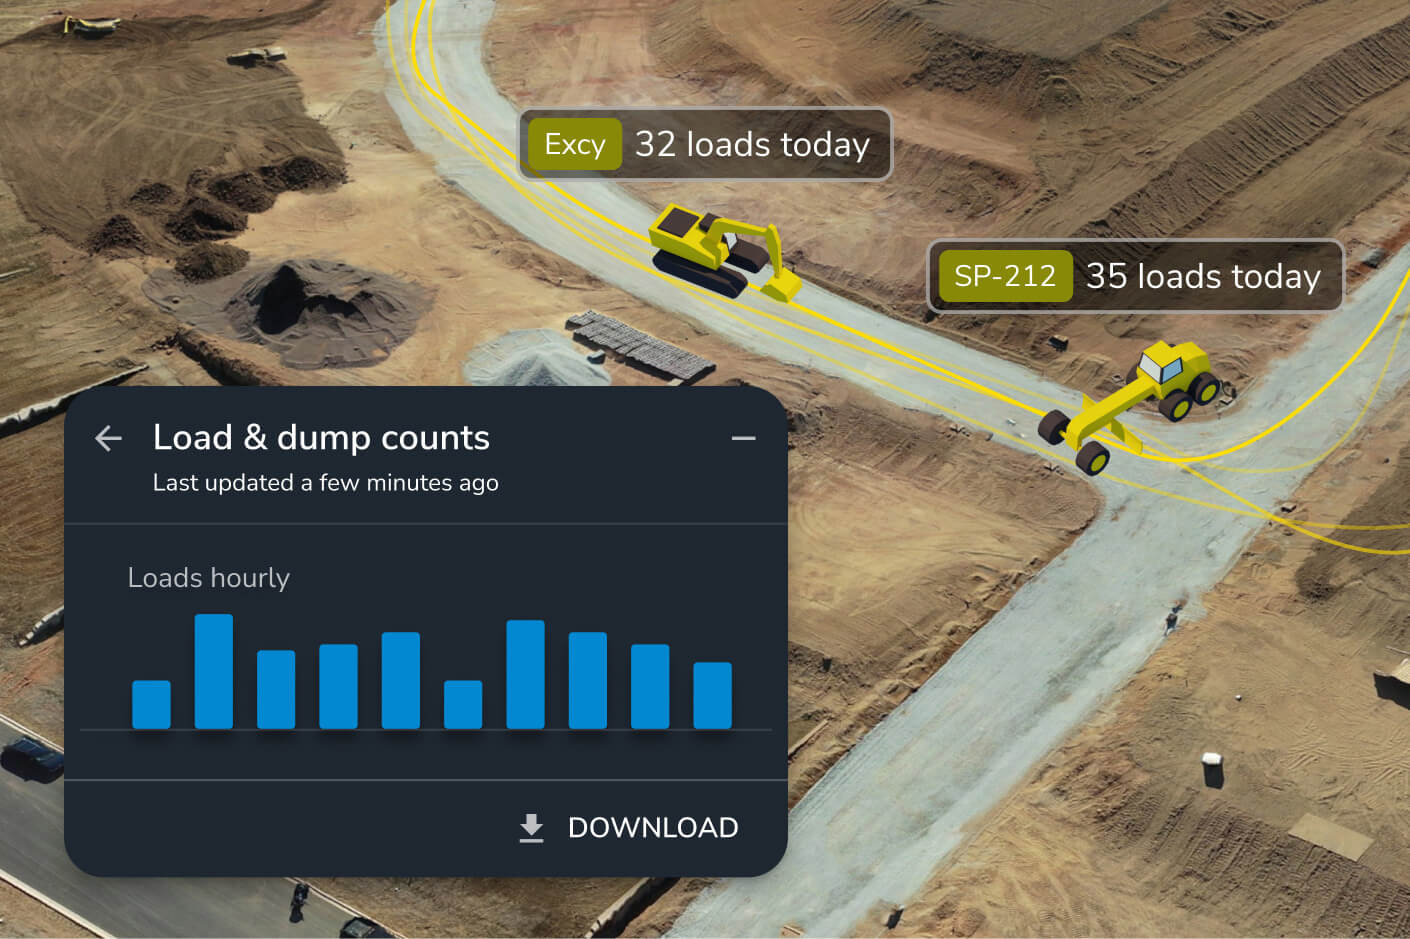
With Propeller, daily reports are generated automatically using real-time field data from DirtMate and your drone survey data. Scheduled reports land in your inbox each day — covering volume heatmaps, load counts, cycle times, and machine activity — with no manual compiling required.
A useful construction daily report captures progress against design, material movements, stockpile volumes, machine utilization, and any grade or elevation changes. Propeller’s automated reports include all of these, pulling from DirtMate machine tracking and drone survey data so nothing gets missed.
Automated reporting saves hours of admin time, reduces the risk of manual errors, and gives project managers and site supervisors a consistent, data-backed view of what’s happening on site. With real-time insights from Propeller, teams can spot issues early and make confident decisions without waiting on end-of-week reconciliation.
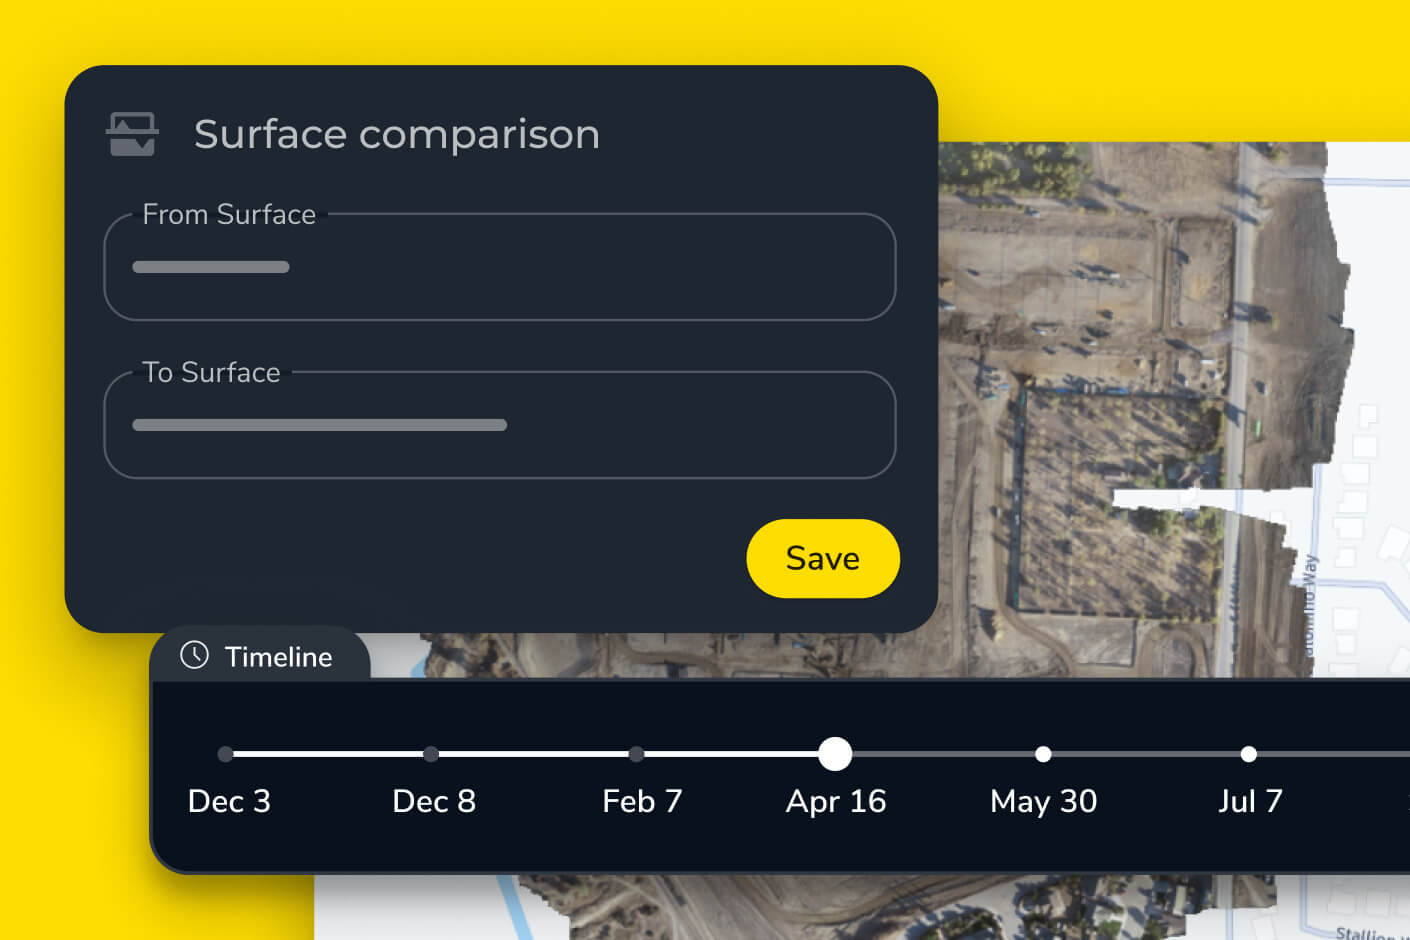
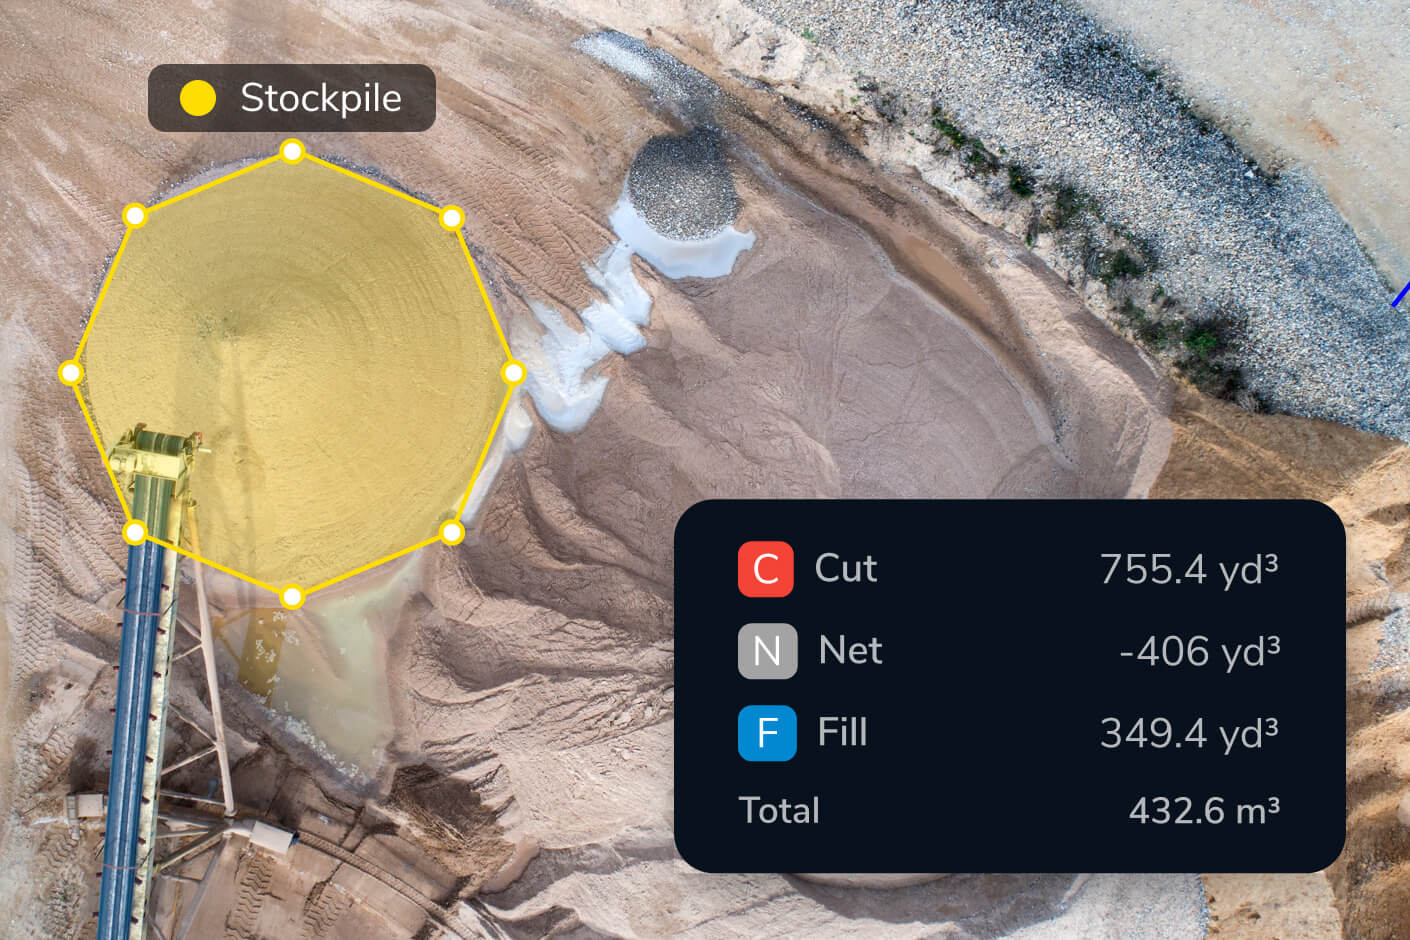
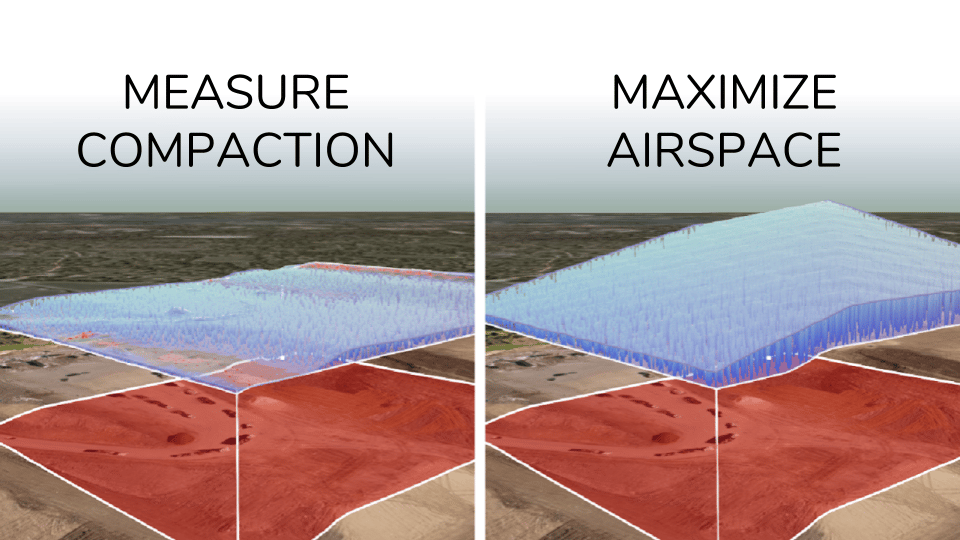
Drone surveys generate accurate 3D surface data that Propeller uses to calculate stockpile volumes, track earthworks progress, and compare current conditions against design plans. That data feeds directly into your reports, replacing manual estimates with survey-grade measurements.
When your team can see live machine positions, load counts, and progress updates as they happen, it’s much easier to catch problems before they compound. Propeller’s construction site monitoring and reporting tools give project managers, surveyors, and site managers a single source of truth — without waiting for someone to compile a report manually.