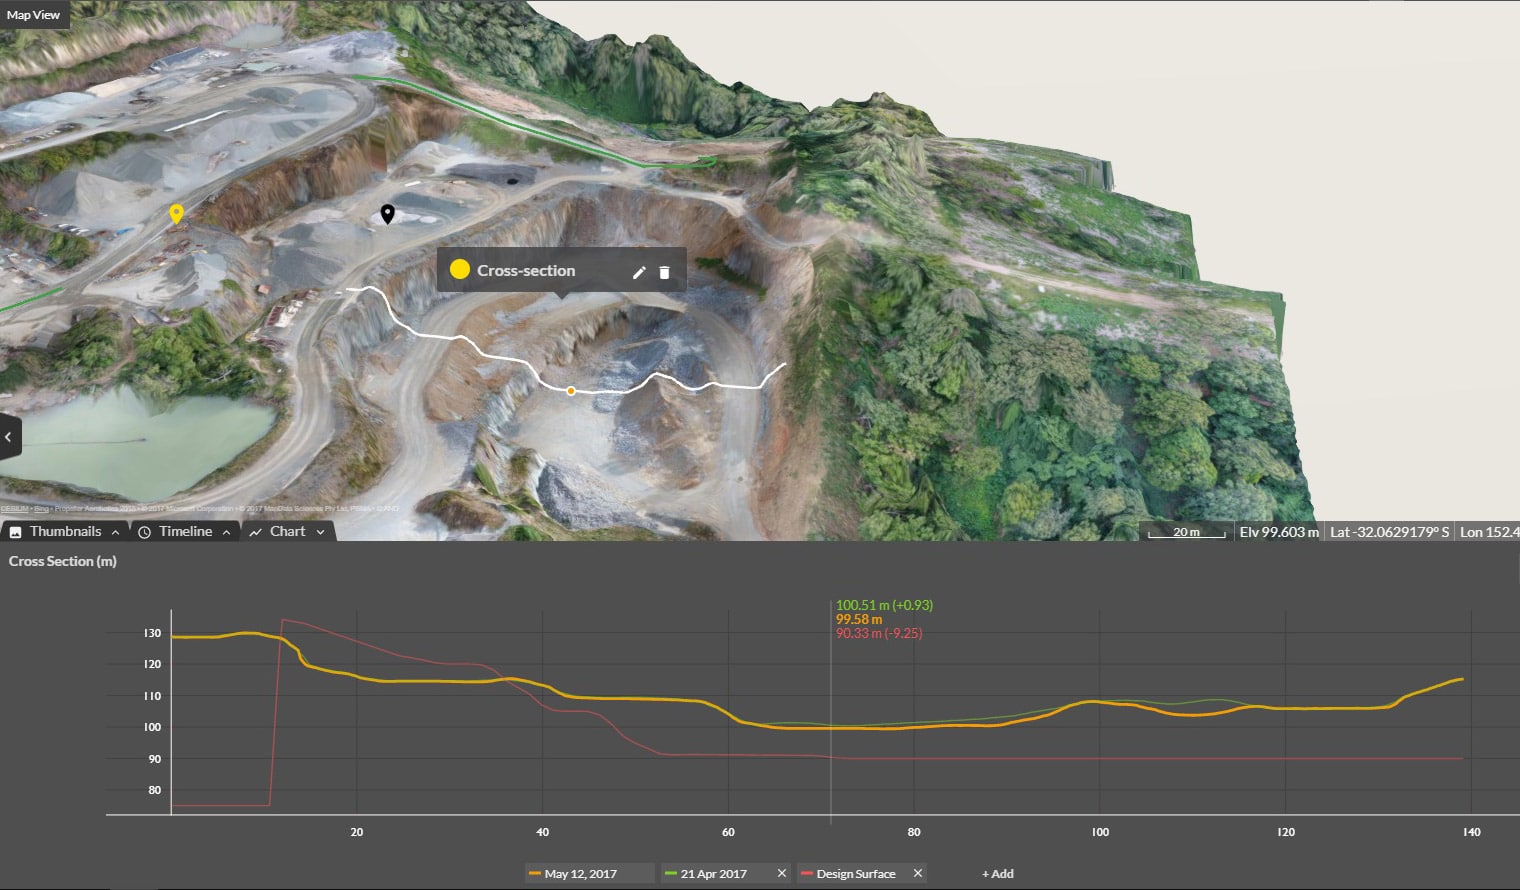
Cross Section Survey in a Matter of Minutes Using Drone Data
With the power of drone-captured data and the Propeller Platform, surveying cross sections becomes as…
Spot hazards before they’re a problem, keep crews informed, and track safety compliance — all on a single platform.
Get the insights you need to maintain high safety standards on-site and document every step. Identify and track hazards, measure critical safety features, and share the details with both field crews and office staff to prevent accidents before they happen.
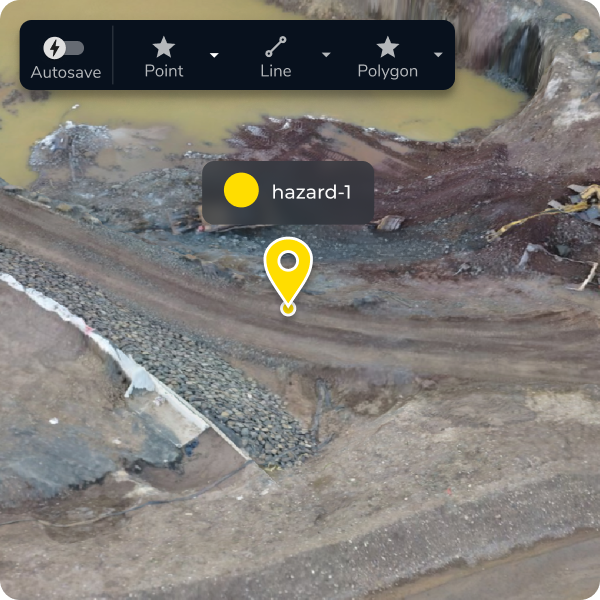
Everyone works safer when they know what to avoid. Identify and track hazards with easy-to-read site surveys, helping you proactively address risks before they cause problems.

Share clear visual records of hazards—from drone images to quick field snapshots and notes—so teams can make better decisions on-site.
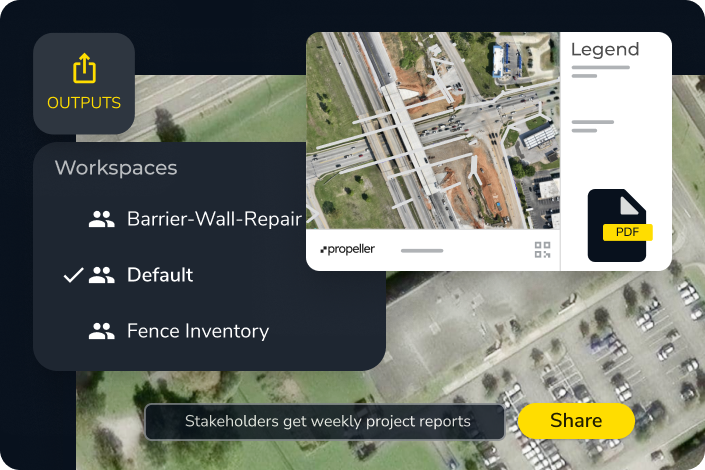
Track and document safety hazards over time, automatically generating digital records to streamline compliance reporting and prove your site meets safety standards.
Track surface movement, slopes, and water levels. Get automated alerts when conditions change, so teams can react faster to potential risks.

“We bought Propeller to track quantities, but now planners, environmental, and safety teams also use it for planning, marking issues, and identifying hazards.”
– Pawell Szumski, Engineering Survey Manager at Wills Bros

Identify hazards and stay ahead of risks with Propeller’s accurate, up-to-date site information.
Propeller automatically generates digital safety records over time as you conduct drone surveys and document hazards on site. You can track hazard resolution, attach field photos and notes for on-the-ground context, and export compliance reports as PDFs or CSVs — giving you an audit-ready record of your site’s safety history without manual documentation effort.
Yes. Propeller lets you mark hazard boundaries and points directly on your site map, attach photos and notes for context, and auto-capture coordinates for accurate location tracking. Because every survey is timestamped, you can review your site’s history to see when hazards like cracks or erosion first appeared — helping you identify trends and demonstrate that issues were identified and resolved.
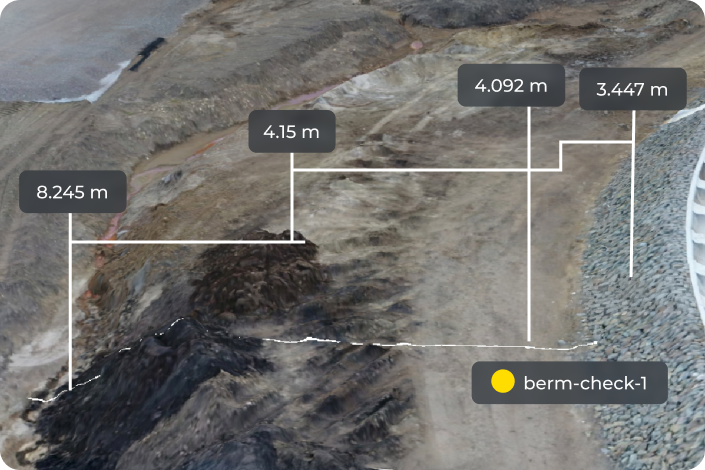
Propeller includes dedicated tools for both. For berms, you can measure heights directly on your 3D site map and visualize them color-coded by risk level to quickly spot anything approaching a violation threshold. For road grades, the Gradient Layer evaluates all on-site roads simultaneously — measuring grade in percent, degrees, or ratio — so you can identify problem areas before they cause access issues or rollover risk.
You can export hazard reports as PDFs or CSVs containing site-wide measurements and annotations. Scheduled reports can be set up to run automatically, and interactive hazard maps can be shared via browser link so field and office teams always have access to the most current version — no file sharing or version control required.