Unearth your potential with underground utility mapping

Read Time: 4 mins
Quick links

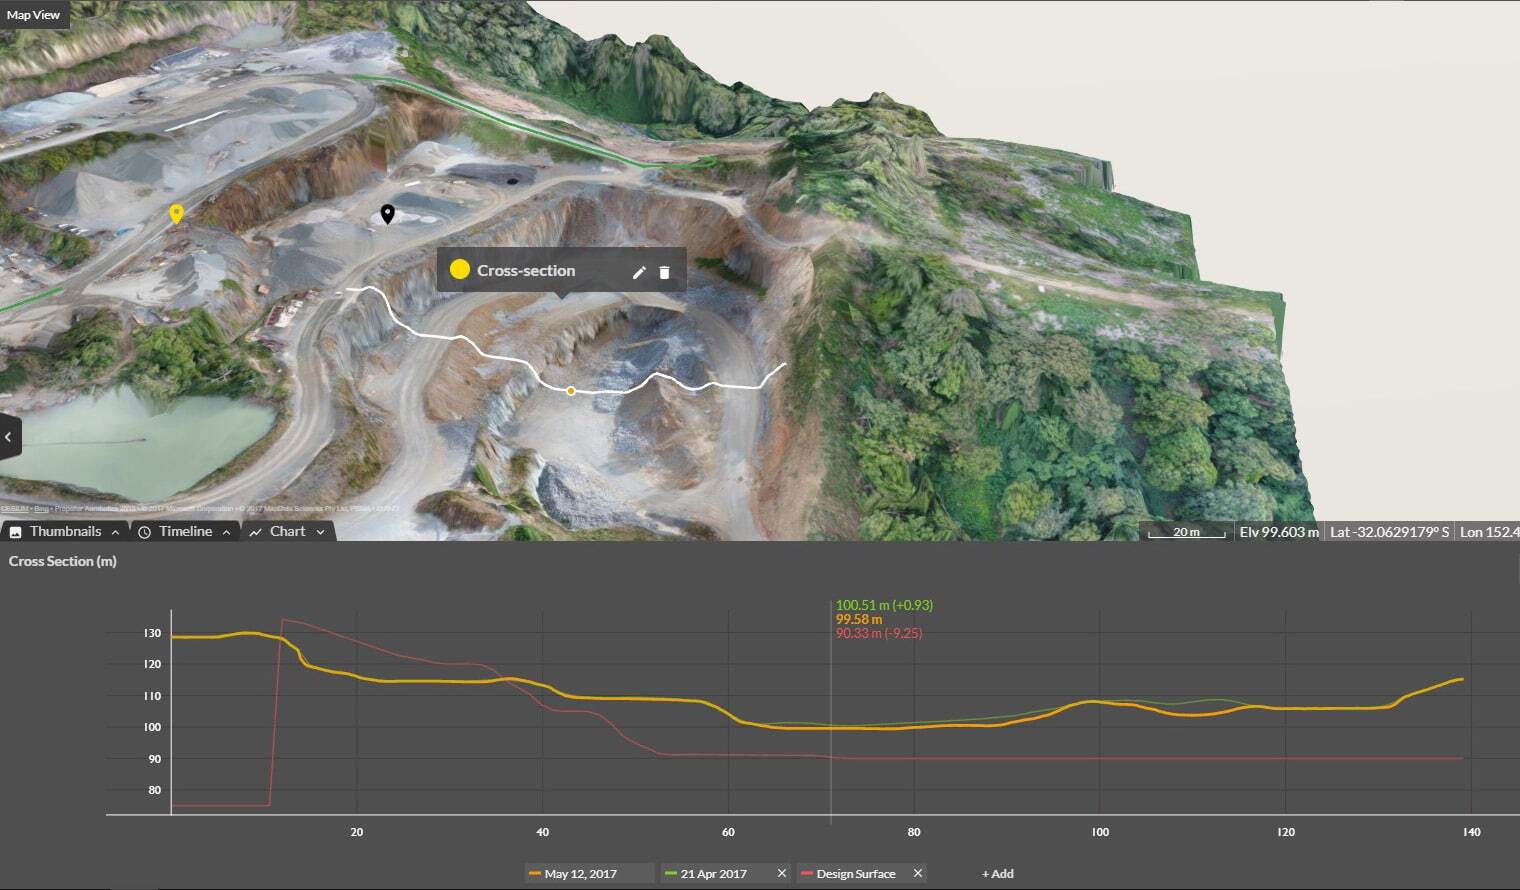
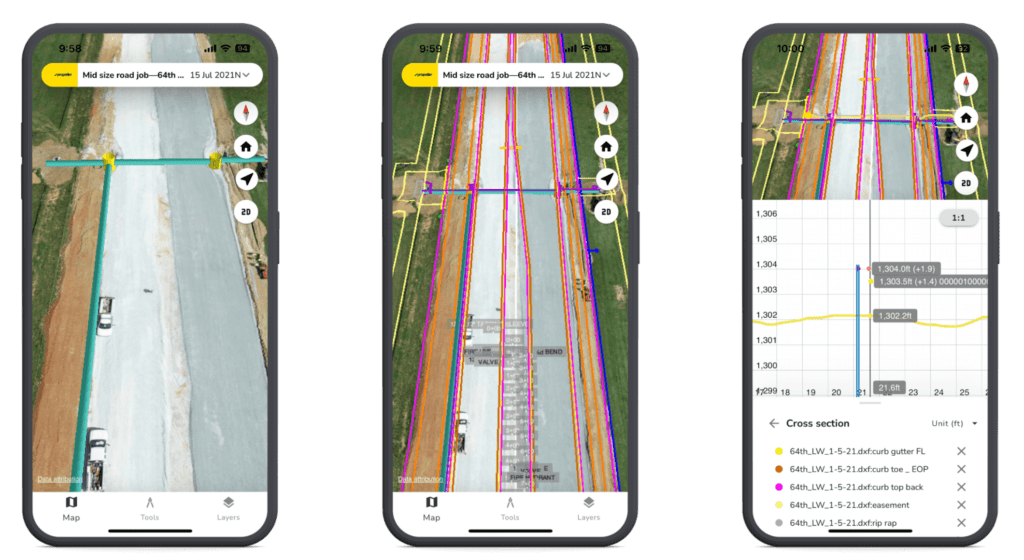
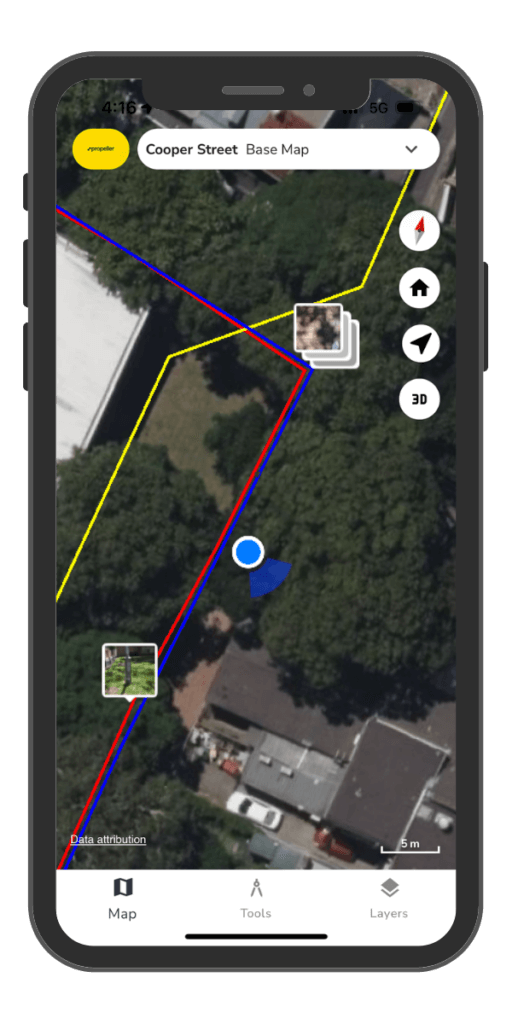
    Learn what a point cloud actually is and then how drone data is integrated with a point cloud to build a 3D worksite model. 

    In the bustling world of construction, any tool that adds both precision and safety is worth its weight in gold.

    Propeller has been doing both for a long time with our 3D mapping software, and we’re excited to unveil an upgrade that will help you see below the surface with underground utility mapping. An interactive underground utility map is now available on both desktop and mobile platforms as an enhancement to our existing Cross Section feature. 

    Read on for an overview of how this new feature works, who it’s for, and why it matters.

    The Power of Interactive Underground Utility Mapping

    Obviously, drone surveys can’t capture subterranean features—but design files can. Propeller’s underground utilities map is a significant cross-section feature upgrade, offering an unprecedented level of situational awareness of precise utility locations. It delivers a dynamic subterranean utilities map right into the palm of your hand for on-site use, aiding in clash detection and helping prevent the nightmare of a utility strike. 

    underground utility mapping gif

    In other words, this upgrade is more than a flashy new feature—it’s peace of mind.

    So why dig this feature out now? Over the past few years, we’ve heard your requests for a tool that makes mapping underground utilities easy. But we didn’t just want to deliver; we wanted to do it right by bringing this advanced feature to life on mobile, where it can have the greatest impact in the field. 

    You might say that underground utility mapping sits at the perfect cross-section of Propeller’s strengths: survey-grade accuracy, coordinate system support, and expertise in delivering data to on-site workers through mobile. 

    Why underground utility mapping matters

    Striking underground utilities (gas, water, electrical, or telecommunications) is one of the biggest risks in construction, particularly during the earthwork phase.

    Research shows that utility strikes usually occur at the end of a long chain of missed opportunities to spot—and prevent—the problem. Breaking this chain at any point is all it takes to avoid disaster.


    Thankfully, underground utility mapping is primed to provide that potentially lifesaving step, granting you the power to visualize the subsurface world accurately. From gas lines to electrical networks, having the blueprint of what lies beneath at your fingertips fosters a safer and more informed worksite. 

    Gather this data on desktop, or use the mobile app to deliver critical insights whenever and wherever they’re needed.

    Who should dig into the underground utilities map?

    If excavation or grading is on your agenda, this feature is for you. For those in the field, it acts as a reliable companion, helping gauge your position in relation to various utility designs. This feature also shines brightly in the realm of clash detection, where it aids in identifying potential points of conflict between designs.

    A word of caution, though: Underground utility cross-sections are only as good as your design data. If your design data is poor, you’ll get less value from these cross-sections, so make sure you’re kicking off with high-accuracy inputs.

    Down to business: How does it work?

    Start by activating your design files (e.g., IFC or DXF) to represent the utilities you want to map. Next, simply point and click using the cross-section tool to explore underground utility locations and measurements. Hover over plotted points to determine their distance from the current survey surface and view element identifiers. The process works just as seamlessly on both desktop and mobile.

    For the data die-hards out there, here are a few more highlights:

    • Support for IFC files: View 3D representations of piping and other large utilities.
    • GridPaper renderer: An improved cross-section renderer that delivers a consistent viewing experience on both mobile and desktop.
    • Cross-section measurements: Enable comprehensive insights within the app.
    • 3D geometry and sliced design strings integration: View IFC and DXF files in a single cross-section. 

    Next stop: Your underground adventure

    We can’t wait to see how you leverage this new feature to enhance safety, increase efficiency, and up-level innovation on your worksites. Start exploring now on mobile or desktop, and let us know what you think. 

    Quick links

      Related articles

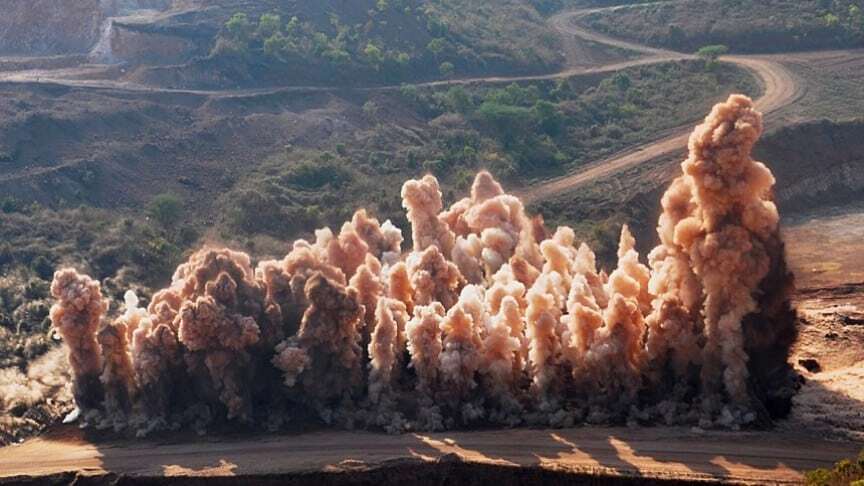
      Better Blast Planning, Monitoring and Quarry Reporting Using Drone Data

      Making decisions with the most up-to-date and reliable information is critical for any site manager,…

      Six smart ways to use drones in mines and quarries

      The use of drones in mines and quarries is common, but these sites are highly…

      Cross Section Survey in a Matter of Minutes Using Drone Data

      With the power of drone-captured data and the Propeller Platform, surveying cross sections becomes as…

      Ready to learn how Propeller can power up your worksite?

      We’re happy to show you how Propeller can power your worksite, and boost productivity.

      Related articles

      Drone pilot in hi-vis flying a drone next to a crane, with an AeroPoint on the floor.

      Things To Know About Ground Control in Drone Surveying

      Ground control is the go-to option for turning drone data into highly accurate, survey-grade models.…
      DJI M4E flying in the sky

      Propeller’s Drone Guide: DJI Solutions for Commercial Operations

      At Propeller we love testing new drone hardware and we are processing hundreds of drone…

      Telecom Tower Inspection using DJI Phantom 4 Pro: Step-by-Step Guide

      A few weeks ago a new DJI Phantom 4 Pro was delivered to our office.…