When it comes to data processing and quality assurance, the whole practice can seem like a black box from the outside. We want to change that.
Many of our customers are experts in their own rights when it comes to site data, and they’ve asked us to explain how Propeller’s QA works behind the scenes. We’re happy to give everybody a look inside this important workflow.
At Propeller, data QA is carried out by our data team, a group of subject matter experts who all hold degrees in geodetic sciences and engineering. They are pros, who know their stuff backwards and forwards. Sometimes data support or tech support means you’ve got customer service representatives on the other end of the line. That’s not the case here.
Drone survey data QA basics
First, let’s get a few basic principles out of the way. Propeller does quality assurance on every dataset that comes into the Platform.
This happens for multiple reasons. One of which is because we need to have useable data to make your 3D surveys in the first place. If, for some reason, the drone-captured images of your site were blurry, under- or over-exposed, or didn’t have enough overlap to be stitched together with photogrammetry, we couldn’t provide you with a survey due to the poor data quality. Catching issues like these beforehand saves everyone time and money.

For the imagery part of QA, we use a combination of our software and experts reviewing the data. You might have gotten a message in the data uploader on the Platform saying you’re missing some data or something similar—that’s part of data QA.
Not only do we need to ensure we can render complete 3D site surveys, but also ensure their accuracy. If they aren’t, measuring features on site survey to survey would propagate errors through every measurement you make, making your surveys useless—or worse harmful to your business.
So how does Propeller ensure data quality? It comes down to a few distinct elements: checkpoints, image quality, and ground control. Some of these elements vary depending on if you have a single dataset (i.e., one survey of your site) or multiple datasets (multiple surveys of the same site over time).
Checkpoint validation
On some datasets, especially those that use a PPK workflow, you might have AeroPoints laid out as independent checkpoints, while others are used as ground control. The difference here is that we don’t use checkpoints to make the 3D survey, we use it to double-check its accuracy.
For each survey using checkpoints, we provide you with a report to do your own QA and see the exact accuracy numbers for yourself. (We’ll go into self-QA further down.)
Checkpoint workflows are great for single surveys
Checkpoint workflows are also the best way to do quality assurance on single datasets. When you’re only flying a site once, there is no previous data to compare against for consistency and accuracy.
In this case, to improve your 3D site survey quality and get the peace of mind that your data’s been independently checked, checkpoints are the way to go.
As stated above, this doesn’t change the way you fly. You still lay out your GCPs like before, but during your data upload you designate some GCPs as checkpoints. Then you can check the final 3D survey accuracy against those values. We’ll go over what the reports look like further down.
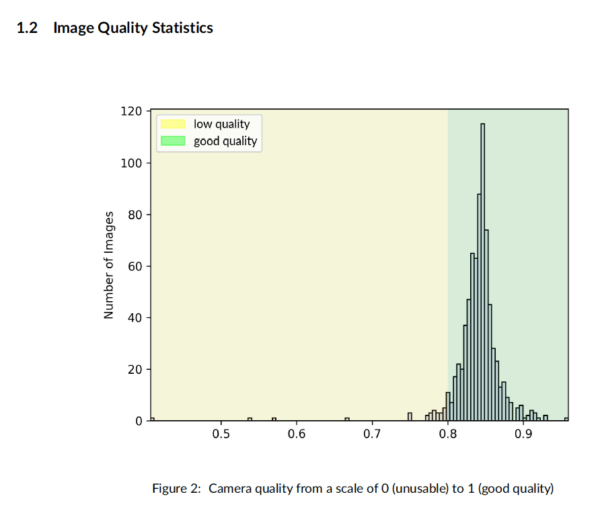
Image quality and drone flight path
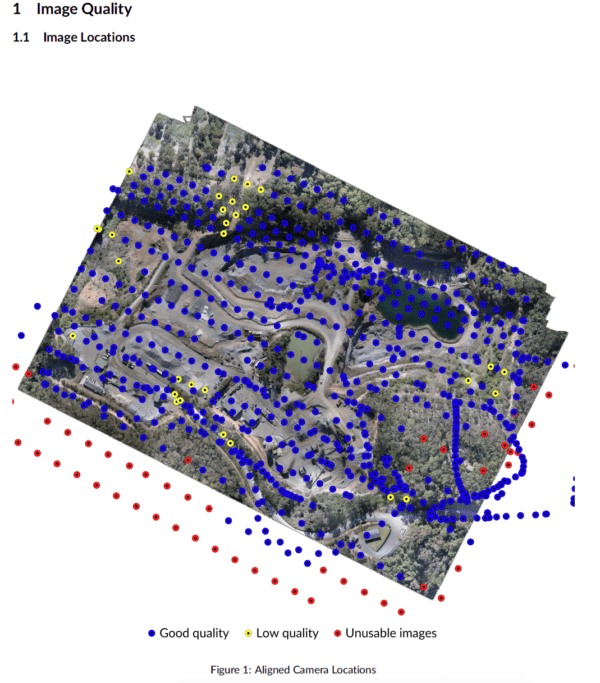
The next element is checking image quality—both the technical aspect of the photos themselves as well as overlap, drone flight path, and photo locations.
Such image quality checks are a differentiating factor of Propeller’s QA. Typically, photogrammetry engines focus on how well photogrammetry has worked for a particular dataset and less on how good your images are.
At Propeller, if something went wrong during flight with your photos, we want to show you how it went wrong, how it’s affecting your data, and what you can do to fix it.
Assuring consistency for multi-survey sites
For all of our QA, we use a combination of software and expert audits by real people to check different surveys.
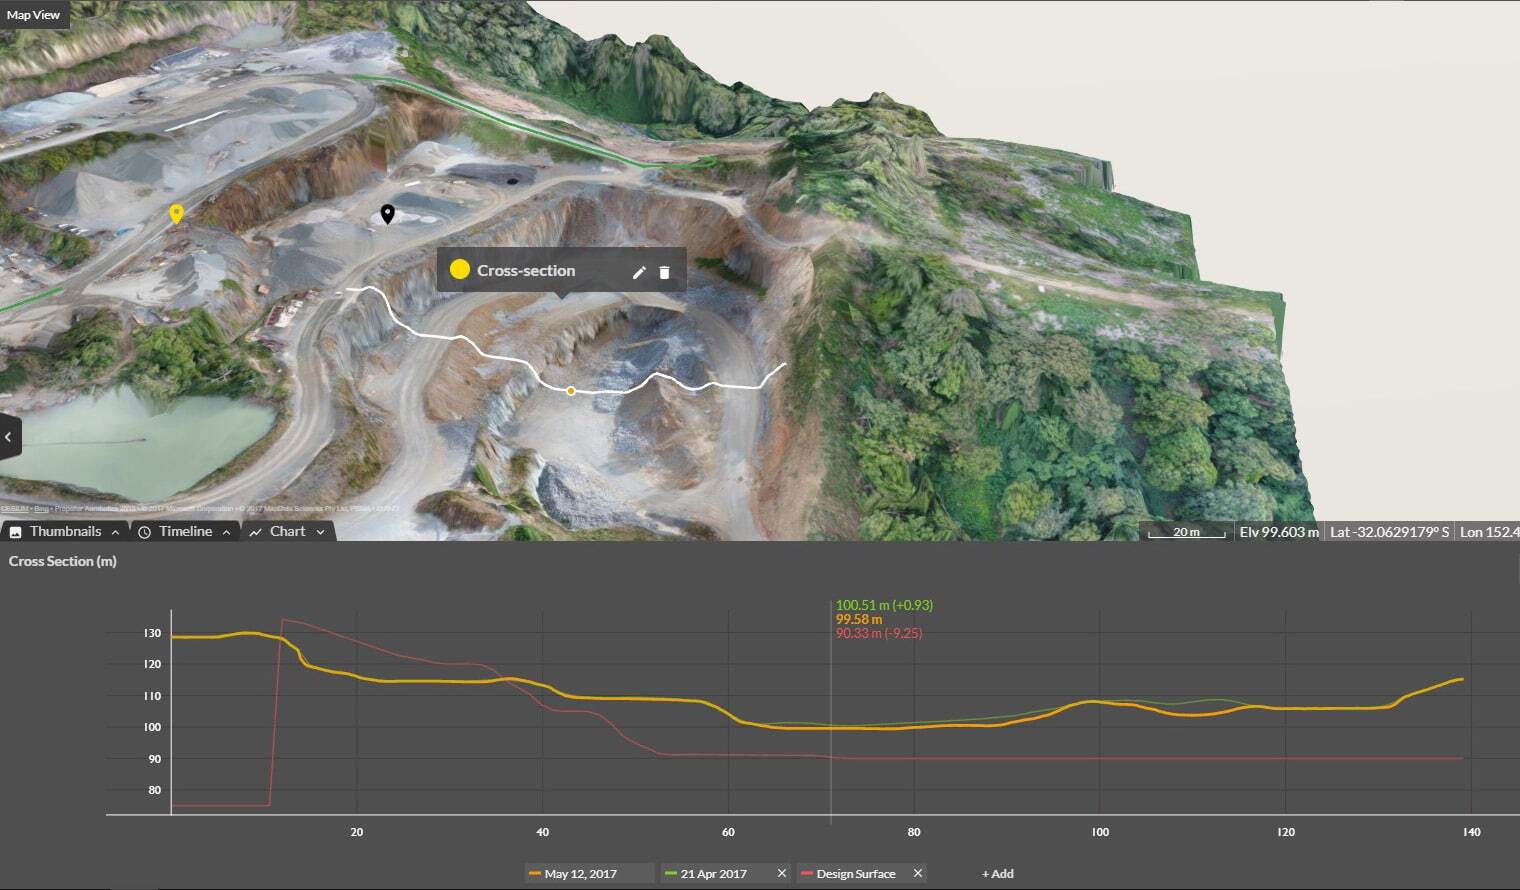
In addition to image checks, checkpoint processing, and real eyes on your data, if you’ve flown the same site more than once, the recent survey is automatically compared previous ones to make sure they match up.
For every survey you submit, height differences of 100mm in more than a quarter of your survey area sets off an alert to one of our data specialists. They review the dataset and decide how to proceed.
This could mean reaching out to you to start a conversation about camera settings or just spotting that your site had a lot of earth movement that the computer didn’t understand.
Enabling you to run quality assurance yourself
Depending on what your responsibilities are, you might want or need to check the data quality of your 3D site surveys for yourself. We want to make that as easy as possible. With every dataset, you automatically get a processing report available for PDF download in the Platform.
In fact, you get the same info we use for quality assurance, not a watered-down version. These documents are what our data teams uses to do debugging on their end.
This document includes:
- Image quality check
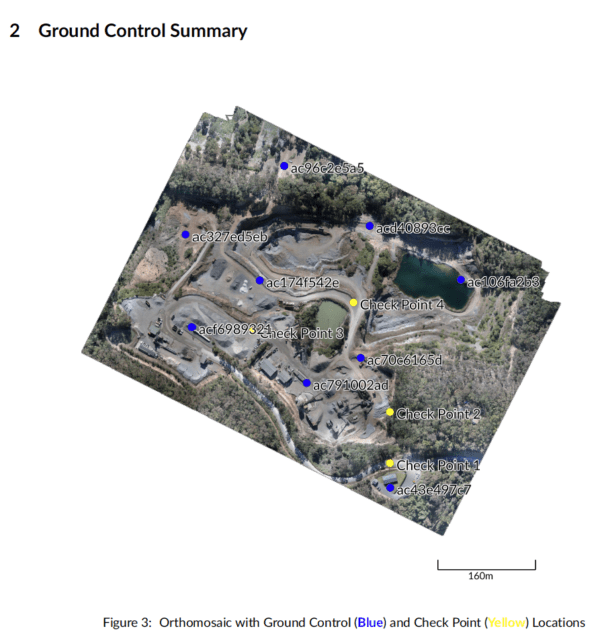
- Ground control summary
- Heatmap of filtered survey areas
- Total RMS error of survey
We covered some of these elements above and their example report formats, so let’s see what the others involve.
Your ground control summary is a color-coded map of where your GCPs are located. The colors indicate which points we used to build the model and which are checkpoints for independent validation.
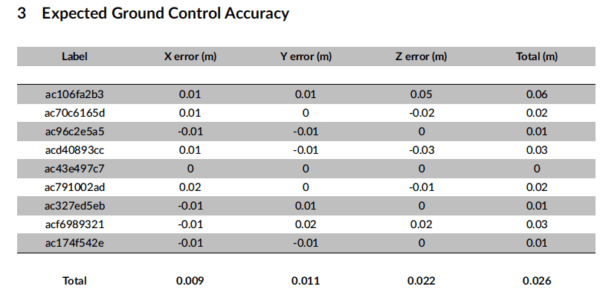
A summary table lays out the expected ground control accuracy, indicating how well the models fits to ground control positions. The report here breaks this down for easting, northing, and height.
We also provide a heatmap of filtered areas of the site, so you can see exactly which areas are affected.
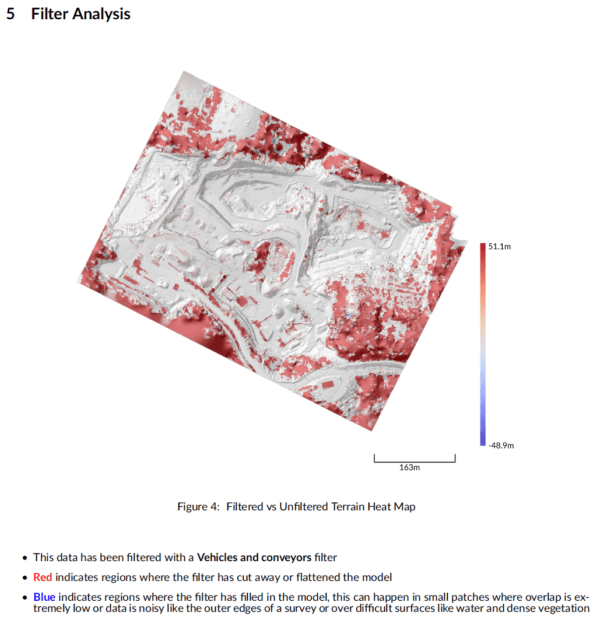
When you upload a survey, you can select a filtering level for your data. From bare earth to just equipment and vehicles, it cleans your dataset of site obstructions and improve measurements.