Alright. Let’s get this show on the road then.
Let’s get it rolling. Okay. So, again, I’m Chelsea. Glad you’re here. I just wanted to go over just kind of how this how this will run.
So this session will be recorded. You I already received a chat, so continue to send chats our way. I’ll be monitoring it and responding throughout. If there’s anything I won’t answer during the show or Micah doesn’t, we can follow-up with an email.
So it’s recorded. You’ll receive this after the event.
Everyone will be muted besides me and Micah just to keep things clean, but feel free to Yeah.
Stay active in the chat and use reactions to reengage. It should be about forty five minutes or so or so going through the different content and, like, some walk throughs, and then we’ll leave fifteen minutes at the end for all of your questions. So you can put those in the specific question tab on the right hand side. And then I will transfer over to Micah.
Perfect.
We kind of already did the introductions, but just for anyone that’s joined late, Mike Little, very technical background, been with Propeller four years, and I’ll be running you through everything today.
Just a quick agenda of what we’ll be covering. So the first topic is what is propeller hydrology, when, and why teams use it, and then some of the problems that we’re trying to solve.
The second thing that we’ll be covering is surface modeling for accuracy. So things to know before creating your hydrology strategy.
Basically, good data in is gonna be good data out.
Third, we’ll run through some of our capabilities.
These features are powering worksites all over the world, and a lot of our customers rely on these on a daily basis. So just showing you what those tools look like live, some of these specific applications and use cases, and then at the end, we’ll do our live q and a where I’ll answer any questions that you guys have.
So first off, what is propeller hydrology and more importantly, what tool or what problems are we trying to solve? So some of the common issues that arise on-site are that drainage plans can deviate from current site conditions.
This could be due to outdated survey data. It could be due to inaccurate plans from the get go. So having an up to date drone survey of your site is gonna create the most accurate plans for when the site’s getting started all the way through till the end.
Another common issue that people run into is flagging risks can be very difficult to communicate across different teams. With the Propeller platform, you guys will have a full visual of your site. It’s web based, so anyone can log in and see the data so you can run your analysis and then share it amongst your team members very easily.
Another common problem is that runoff and hydrology problems in general get discovered retroactively.
Obviously, there’s a lot of issue issues associated with this. The main ones being are that it’s gonna be more money out of your pocket. When these problems get discovered after they happen, that’s downtime for your machines. That’s more planning going into place.
Sometimes it could be a fine, but the main thing is being able to simulate these rain and weather events so that you can get out ahead of them before they are causing downtime resulting in fines and just preventing those from the get go.
And then the last one that’s most common is just this documentation can be very time consuming.
With Propeller, everything lives in the platform twenty four seven. It doesn’t go anywhere. You can run these simulations, and they will live there forever. And it just takes a couple of clicks to create these simulations. So, basically, your site documentation will be available whenever you need it as well as it can be created very quickly.
So some of the places that technology helps the most, at least within our ecosystem, is these four tools, which I’ll run through live later. But the first one is our flood to level tool, and you’ll see a visual of what that means. But, basically, you have your survey of your site. You can set an elevation and see exactly where it would be affected on-site before it’s an issue.
This tool could be useful if you’re, say, working on a coastal project and there’s historical data of where flooding has happened in the past and how high of an elevation that’s gotten to. You can put that elevation in there and then see exactly where on your site flooding will occur based on historical data.
The second tool that we have is our surface runoff tool, and this maps how water moves across your terrain the moment that rain hits. Again, it’s a visual, and it shows flow paths in a really easy to digest way across your site.
The main value of this tool is that it draws your eyes to where problem areas are.
It’s not necessarily gonna give you numerical values, but if you need to put in a new swale or a new bank or a new drainage outlet, using this tool will show you exactly where those things should be so that you avoid any runoff that you’re not expecting.
The third tool is our catchment and watershed analysis.
With this tool, you can click on an outflow point, and it’ll basically show you that entire catchment area. Again, we’ll run through this live, and it’ll make a little bit more sense later. But you’ll still see your flow paths, and you can click on any point, and then it will create a shaded blue area of wherever rain falls. It’ll end up at this point. So, theoretically, you could click a point anywhere on your map, and eventually, it would fill up entirely. But, again, a great way to make sure that your drainage plans are working as they expect based on the ground that’s actually out there on-site.
And the fourth one, which I think is the coolest tool, is the direct rainfall simulation. So this one, you can kinda test your drainage plan against the real storm event before the rain does it for you and act on either those problems or validate that everything you have in place is working as you expect.
This tool takes a CSV of the rainfall data and then projects what that rainfall event would look like on your site. CSV data, can normally find from universities. You can find them from national weather centers. Download those CSVs, put them into Propeller, and then it is a one to one comparison of what that rainfall event would be. So if you’re gonna get two inches of rain across the course of three hours, you can actually see how that would impact your site rather than just a default simulation. So it’s gonna be real world data projected onto your site.
And then who benefits from hydrology tools?
And I really think it’s everybody, but just breaking it down in a little bit more detail in the construction industry, you’re gonna be able to avoid those delays that I previously mentioned. Protect your crews if there’s washouts or your haul roads are being impact impacted by rain. And then also maintaining that SWIP compliance. That’s gonna be a really big one. If you have, you know, a neighborhood right across from the site and there would be runoff going into that site, you could get hit with an unpermitted discharge. Fine.
So just staying on top of that in the construction industry is obviously of the utmost importance.
In the mining and aggregates world, preventing water accumulation in critical areas is gonna be key. So those pooling areas, which we can do with the direct rainfall simulation.
If you’re working down in the pit, you wanna make sure that you’re not having equipment go through wet areas. You’re maintaining that production uptime.
Also goes back to that haul road analysis. So preventing washout and preventing have to preventing rework on those haul roads is just gonna maintain that uptime for your machines on-site. As soon as a haul road has to get reworked, basically, everything’s gonna have to get rerouted. You’re doing less loads per day, less money in your pocket.
For heavy civil and earth movers, again, grading decisions. This is gonna be really, really grading.
And when drainage on-site is as you expect it to be, when the next crew goes out there and there’s a problem, you could be the ones that are falling back onto that problem, having to get back out on-site. Maybe you’ve already started your next project. Again, that’s more time that you aren’t working on the project you’re supposed to be. So avoid that rework, avoid any erosion, and keep things on time.
For the environmental teams, this is visual evidence for regulators so you can prove that you are managing water on-site.
If you’re hit with a dispute, you can say, no. We put this swale here.
We’ve got a drain here. There should be no runoff, and we’ve got date and time stamped data to prove it. Of course, every dataset that you upload with Propeller lives here indefinitely, so you can always go back to it whether it’s two months, six months, a year, and prove that when you left site, there was a plan for drainage and that you executed on that plan.
For surveyors and GIS, you can integrate that catchment data into three d maps and deliver those better site reports.
So everything can be exported into a PDF report. You can grab a screenshot, invite different members from different teams all into one platform where they can collaborate on the same map. They can see the data in real time, and basically deliver those reports as people need them without a whole ton of clicks. So it really does streamline the process.
And then for project managers, this is gonna be key for making those confident decisions beforehand, before problems happen in the real world. So whether it’s a greenfield survey and you’re just about to break ground or you’re finishing up on the job, knowing that the decisions you make are backed by data is gonna give you all the confidence you need to pass it on to the next crew.
So, again, it’s that time frame, accountability, and just making sure the confident the decisions you make are made with confidence.
And I mentioned this earlier, but the tools that we run are based off of your survey data. So the closer that that data is to real world conditions, the more accurate your results will be, and you can set ahead stay ahead of these liquid related risks better.
For capturing current conditions, it’s gonna be the most up to date imagery possible, so it’s not relying on an outdated model. Basically, the data that we’ll be providing to you through these hydrology analysis will be based off of one hundred percent up to date data. So post clearing, post grading, whatever phase you’re in, that’s the surface the tools will model off of, and you don’t have to to bat an eye at how we’re projecting that site data.
Second aspect is the site coverage and accuracy matter the most. This is always of the utmost importance to Propeller, but accuracy always wins. So a clean, evenly covered survey gives you sharper flow paths and more precise catchment boundaries. As long as we’re getting good data in, we will get good data out, and that’s definitely something that we live by.
And then the last aspect here is you don’t need to be a GIS expert.
I studied GIS in school and used a bunch of different softwares and programs, and I’m definitely biased, but I’ve found Propeller to be the easiest. There’s not ten thousand different tools you can click on. It’s designed to be straightforward. It’s designed to get the data into the hands of whoever needs it, whether they’re a pro at CAD or not or GIS.
So we’re providing you with tools that anyone can use. We want people to collaborate on the platform. It’s visual. It’s simple under to to understand, and you can communicate updates or plans all from one place where everyone can can get in and and be a part.
So I’ll jump into the live walkthrough now. Like I said, it’s four main tools that I’m going to be showing, and we’ll run through some of the main applications of of each of those tools.
Okay. So the first tool here is the flood to level. So I mentioned this previously, but this can be really good for one use case if you are on a coastal project.
For instance, we have a customer, the city of Babylon, who is using Propeller to basically click on a point on their beaches on Long Island and put in a flood level and see exactly on their up to date map where that would take place.
So it’s a pretty simple tool. We can pick a region. For now, I’ve got the entire site as the region. We can either pick a level from the map, so click the big yellow button, click on a point, and see where flooding would occur, or we can type in a custom elevation.
So for instance, if we wanna see up to five hundred and fourteen feet, type that in. We can go up to five thirty, but you can really see how quickly based on a certain elevation of a flood, specifically where that will affect our site. So if you have historical records, you can find them, put those into here if it’s gonna be a major flooding event, see which parts of your job site are gonna be safe, and then start doing your planning from there. So wherever you need to put mitigation efforts into place, get out ahead of them with this tool.
The second tool here is our surface runoff tool.
So we’ll just draw a whole new region here, actually.
Take the whole site.
Oops.
And this is basically if rain were to fall on-site, this is exactly how it would flow. So we can see our high areas, our low areas, and then with some simple markup tools, which we’ve built in here as well, you can mark those to pass off to other stakeholders who might be interested. So for instance, if we have a storm drain outlet here, we can mark up our drainage areas, really visually represent how water will flow ahead of time, and then it’s really easy to understand for anyone else who might wanna get into the software.
One little kind of subcategory of this tool is our liquid drop feature. So we can click again, the big yellow button, click on any point, and see exactly how water would flow from that specific point. This kinda goes back to that, unpermitted discharge that I mentioned earlier.
But here we are on the Greenfield site, so we haven’t broken ground yet, but we know that if rain were to fall, there would be runoff into the nearby neighborhood. So we can get out ahead of that, put some swales in, and make sure that everything is draining as we as we expect it to so we can avoid some of those fines. We can avoid downtime and make sure we’re working on the project at hand, not fix fixing problems that we didn’t expect.
With this tool, we can also create a custom polygon. So if we wanted to see this entire bank over here and how that’s running, we can create a new region, draw a quick polygon, and it’ll run that same analysis for that liquid drop, but on a much larger region, show you exactly for this specific area, those drainage paths, which can be a little bit hard to see when it’s showing us every single path on-site. So now we turn off the flow path. We can see exactly for this specific area how water is draining, make sure that we’ve got protections in place to avoid any fines or downtime.
And then the last tool I’ll show on this site is our direct rainfall simulation, then we’ll jump over to another site. This is the tool that takes the CSV data of a rainfall event that could be coming up in the future. Again, you can put in custom parameters, so how much rainfall you expect at a given time. For this simulation, we’ve got two inches per hour, so pretty heavy rainfall event.
And then this timeline tool down here basically will show us the pooling areas.
So again, a great tool to get out ahead of any risks that we may have, specifically for mining and aggregates. This can be a really, really powerful tool to show you if you are down at the bottom of the pit, is your drainage expected with to be where equipment’s gonna be working.
At the end of the day, productivity is king, so we wanna make sure that we don’t have equipment going through flooded areas, and this tool will show exactly where that flooding will happen.
So, again, all customizable data and truly fit for events that could actually be happening in the near future. For instance, you have a big storm coming in a week. Go ahead and put this onto your project. Make sure that everything is taken care of ahead of time.
Just really quickly, one thing I forgot to mention on the surface runoff. A lot of our customers are using this specifically today for haul route haul route analysis. I think you could probably see with this turned on if you did have haul routes on-site. So let’s jump over to a newer survey where there’s actually roads built.
We can turn on that flow path.
On this subdivision site, it’s not gonna be as critical, but you can make sure that drainage is happening on a really specific level.
So you don’t have any water flowing down the middle of your roads. They are flowing down the ditches that you’ve built in so that you’re not getting washout. Something that I know is really important to quarries and aggregates is maintaining tire life. Those tires on those large trucks can cost anywhere from thirty to fifty thousand dollars a pop, And worn out roads is the biggest thing that affects tire life. So making sure that those tires stay healthy is really key, and runoff is gonna greatly impact the health of those haul roads. So just keeping them in good shape and also managing that safety and compliance as well.
And then our fourth tool is our catchment and watershed analysis. So there are some similarities from this tool to the others.
What this one is going to do is it’s going to show you the stream network on-site. Again, it’s animated so you can see exactly where water is flowing.
But the real power of this tool is checking that the mitigation that you’ve put into place is effective. So for instance, I know that there’s a drain right here.
If I click on this pick outflow point and click on any one of these yellow lines, it’ll show me the entire catchment area.
So theoretically, I could click on a bunch of different outflow points on every single drain that I have in place, and it should cover the entire site. Now if it’s not, then I know there’s some sort of problem. Maybe the slope isn’t accurate on one section of the site and it needs to be regraded. That’s the kind of quick insight that you can get from these tools to make sure that everything is as planned and anything that you’ve put into place is working as expected.
So those are the main four tools.
There’s lots of different applications, and people are constantly pushing the software to its edge. But really quickly, the main idea, at least in my head, is draw your eye to these problem areas ahead of time to avoid them happening in their entirety.
There’s a lot to get pushed through.
And if you can get out there to do a quick drone flight, you can make sure that everything is draining properly, that you’re not getting hit with unpermitted discharge or leachate running off into another site, anything like that, or sediment going where it shouldn’t. Basically, you can verify your grade with Propeller and then take into the account the environmental risks of a site as well all in one platform where anyone can really collaborate, see the data, and it’s all backed by one tenth of a full accuracy datasets proving exactly how everything will function on-site.
So just really quickly, if you do wanna see this on your own site, there is a link at the top of the meeting to book a demo where we can run through this live, really dig into each tool’s use case, even get you into the platform through a guided session. But if it seems like it would be something that’s valuable to you, of course, hit that link, and we can always talk in a bit more detail on those subjects.
And then beyond hydrology, I’ve kind of led into this a few times, but it really is a full site intelligence platform. Hydrology is just one small aspect. There’s those four main tools, but we’ve got tons of other tools for making sure that your project stays on track and that you’re getting the highest possible margin for each of your each of your projects that you have started. So from the drone surveys, which are gonna be highly accurate, one tenth of a foot survey grade accuracy, three d site maps, so live shared maps that your whole team can access from anywhere, a cloud platform, again, you don’t have to process in house or bog down a computer. We’ve got twenty four seven processing going on. So anytime that your team needs data, they can access it. Anytime that you need to upload data, you can do so.
The volume tracking, of course, is our bread and butter.
Cut fills, stockpiles, earthworks volumes, most of those tools only take, you know, thirty seconds a pop. So you can make sure that you’re managing your inventory effectively. You’re sending your field crews to the right projects at any given time. If there’s less material that you need to move than you anticipated, you can pull a crew off one site and send them to the next. But, again, volume tracking is definitely our bread and butter, and doing so accuracy accurately is is our big key.
And we’re definitely not a CAD program, but doing design comparisons and making sure that when you are bidding out a project, you are accurately estimating the materials that you’ll need to move. So pull in your designs from pretty much any CAD program, put them on top of your drone surveys, and make sure that the numbers that you’re bidding match up with what’s actually out there on the ground. So, again, tracking your progress in real time using those design files. We really wanna be that central hub for anything survey that pertains to your site.
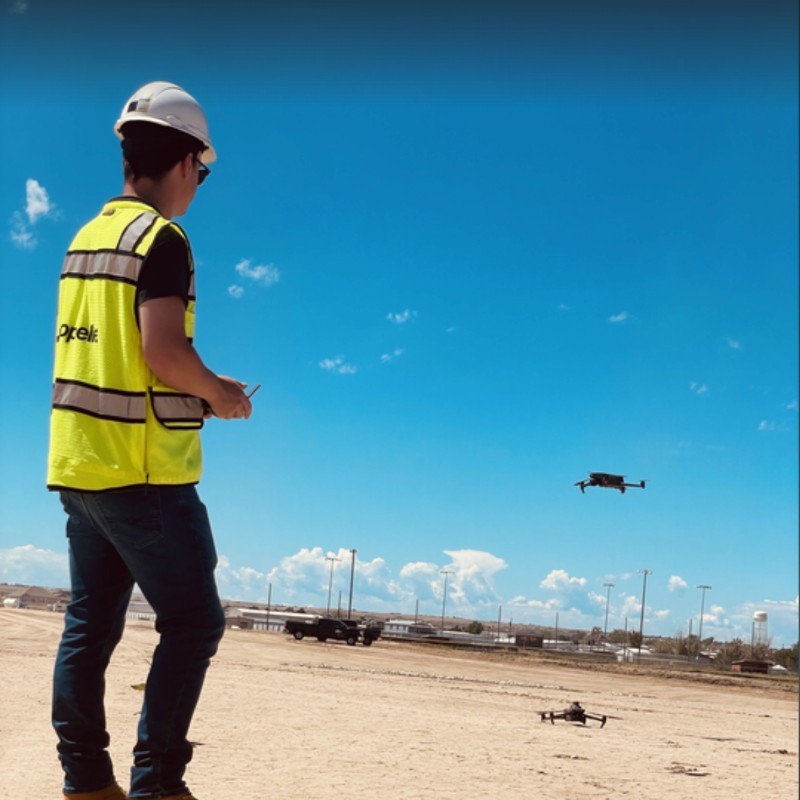
And then if you’ve heard of Propeller, you’ve probably heard of arrow control points. So they are basically a target on the ground that the drone can see that are recording their static location. We then reference that data with the drone photos. That’s how we can guarantee that one tenth of a foot accuracy, and they really are built as an easy button for surveying. There is actually only one button on those arrow points, so you can go out there with your drone, put an arrow point down, click the button, upload that data to us, and that’s the end of the process for collecting the data. Again, we’ve built it to be straightforward. It doesn’t necessarily need to be a surveyor doing so, and anyone can get survey grade accuracy.
We also do work with local site calibrations if you are on a locally calibrated site. So state plane, locally calibrated, You can just drop that calibration file in one time. And then every time that we reference the photos after that, it’ll be based out of that local grid coordinate system.
And then what we just went through today, so the hydrology tools. Again, it’s a big part of our platform. It’s something that our customers are using on a daily basis to make sure that their sites are within conformance, that their sites are safe, and that their sites are following the timeline that they they expect in avoiding that downtime. So, again, it really has been a suite that we’ve designed for all of your project and survey needs.
Awesome. Great. Thank you for running us through all of that. So now it’s up to you.
Continue to put your questions in the q and a tab. So it’s right above the chat. You should see it. So keep sending those our way.
We have plenty of time to get them answered. So the first one that we have is does it account for sediment type?
So no. It does not account for sediment type.
Propeller in its whole is mostly for earthworks tracking, but the hydrology tools are very powerful. With that said, it’s not a true hydrology platform. There’s other platforms out there that can account for sediment type.
We are just basing our flow paths, drainage, everything like that based off of the topography of the survey.
So whether it’s concrete or dirt, we’re assuming that it’s just gonna run off the same way.
In most cases, this is fine, and it’ll still give you a good picture of your site and exactly how things will run off. But the short answer is no. It does not account for sediment type.
Okay. Thank you. And we have another one. So just a refresh, can you show the LiDAR data again?
The LiDAR data?
Yes.
Didn’t go through any LiDAR data today.
Over it. We can if you wanna, like, give more context, we can answer this one live, but we could also pause and because we have a few more.
We can we can run through this one live. I’m not seeing the question.
It’s unsubmitted in q and a.
Oh, okay. There it is.
Erin, do you know what survey we were looking at or anything?
Oh, okay. So the survey data that we that I was just showing was all collected with the Matrice four Enterprise. It’s all photogrammetry data.
These simulations will work with LiDAR data just fine. We’ll basically treat the two datasets exactly the same.
Main key is, of course, seeing through vegetation with the LiDAR data. So if you did wanna see a hydrology analysis on a vegetated site, that’s where the LiDAR data would come into play more.
But everything that I ran through today was all photogrammetry. So common misconception between LiDAR data and photogrammetry data is that LiDAR data is always more accurate. In vegetated areas, that’s definitely true, but on scrubbed and grubbed cleared sites, photogrammetry will still get one tenth of a foot survey grade, but that’s gonna be the real difference.
Awesome. Thank you for clarifying there.
Okay. And then keep sending them. We have a few more. The next one is, could these be used to dispute an unpermitted discharge fine?
Yeah. They definitely could.
So there won’t be numerical values associated, but I might be able to actually switch over my tab here and kinda show how you could use this data to dispute one of those charges. So switch my screen over here.
For instance, we’ve got the neighborhood here, and we don’t want water flowing in. So if we use that liquid drop tool again, and we’ll pick a new region.
Ideally, if we set up our site right, we wouldn’t have any water flowing into the neighborhood here. Now I can see this bank has been created to probably specifically avoid anything running off into there. It’s gonna be another subdivision nearby, so this kind of data is all date and time stamped. Down here in the bottom right, we have our north and easting in elevation, exact elevations down to one tenth of a foot. So there is date and time stamped data to prove what you’ve built is protecting against any unpermitted discharge. If a fine were to happen, you have data to fall back to to show no. When we left the site, this is how it looked, and there definitely wasn’t any water running into that that neighborhood nearby.
Awesome. Thank you. That’s a good visual.
K. We only have two more at this point, so keep sending them through. If not, we can end it early, and then I will get this all over to you more quickly. But the next one is, can this simulate actual weather events?
It can. That was that tool that I mentioned down here in the bottom. So this direct rainfall, we can run through that as well. But, basically, if I pick a region I’ll turn this off.
If I wanna see how a specific weather event would impact this region, I can draw my quick polygon.
And then when you go in to simulate it, this is where you can actually upload that rainfall CSV.
So if you don’t have a CSV, you can change the length and the water depth, the average rainfall per hour.
But, again, if there’s a rainfall event coming up in a week, most universities will create CSVs of this rainfall data. The National Weather Center will create these CSVs as well. Drop those in here and see exactly the impact, you know, two inches of rain per hour would have on your site.
So then you get that that timeline tool that I mentioned down here where you can see exactly where pooling zones would occur based off of real world data.
Awesome. Thank you for walking through that. And then we have a couple more. I’m not sure if you’re in the QA, so I’m not sure which one you wanna start with, but there are two good ones coming up.
Okay. Let me just read through them really quick.
So that’s a a good question.
Harry is basically asking how will soya soil moisture levels and compaction affect drainage and runoff.
At the end of the day, like I said, these are mostly for guiding visual analysis.
We will normally assume that something is well compacted, and most of our customers are on the heavy civil side of things working in dirt work or on quarries and mines. So accounting for absorption levels of every different type of soil is simply something that we can’t provide because it’s it’s too broad. There’s too many. So we have to assume a baseline level of runoff.
I’m sure with other hydrology platforms, if you know the absorption rate of the material that you’re working with, you can input that. But with the tools that we have today, we just have to basically assume that this is how water will run off based off of the topography of the map. So to answer your question, won’t this affect how water drains? The answer is yes.
It would. But this tool is really a way to quickly see where problem areas are based off topography. Are there any high points or low points on my map that I wasn’t expecting? Is there a pooling zone here that I didn’t plan on that’s where equipment’s gonna be working?
We can get out ahead of that based on this visual analysis.
There are much more advanced hydrology suites out there.
Propeller is kinda more of that earthworks survey tracking your volumes kind of tool rather than a dedicated hydrology tool, but these will give you a quick insight into problem areas rather than exactly how water will be absorbed or how quickly.
I hope that answered your question.
Really good question. Thank you for asking that, and thank you for, like, going through the differences. We have one more question if no other ones come through, so last call.
But the last one is how does this help with monitoring erosion?
Yeah. That’s a a really good one.
Again, it’s about identifying those problem areas, and we showed the flood to level tool up here. And I think the main key is you’ve got one tenth of a foot survey grade accuracy where you can see all the inlets and low points on, say, a beachfront, put in that elevation, and see which areas are going to be affected first. So if you’re monitoring a couple miles of beachfront, you can kind of reprioritize where you need to take measures to prevent further erosion based on the data that you have at hand, and being able to use these tools to quickly draw your eyes to problem areas means you can get out to site faster, fix those problems before major erosion happens, and, again, stay on time and use your visual site data to not only visualize them in the platform, but then send that data out to the field crew that would be going to make the fix in the real world.
They’ll be able to open up their phone, see their location live, go to the problem area, fix it, then they can leave a note for their project manager and say this has been resolved, fly it again, run the simulation again, and make sure that it actually has been resolved.
Great. Thank you. Well, that’s all from me. So that concludes the q and a. You can still send them through our chat as Micah wraps up this session, and we can respond out through email. Then, yeah, I’ll toss it back to you to send us home.
Great. Well, again, I just wanna say thank you everyone for joining. Of course, we’ll send the recording link and some additional content after the session.
But, yeah, if you wanna book a demo and see more specific use cases, really do a deep dive into how either these hydrology tools specifically could help you out on-site or just the general volume tracking survey aspect of Propeller in in general, please do book a demo, and we can run through everything in more detail.
And then, of course, stay in touch. Subscribe to this channel.
We post on our LinkedIn frequently, and we’re always releasing new tools based off of recommendations from customers that help people out in the field on their keeping their projects on time, keeping their margins. That’s our whole goal is to keep our customers happy. So so please do keep an eye out for those things.
Awesome. Thank you so much.
Okay. Well, we can end it here. Thanks for joining. I will start getting together all of this material, and we hope to hear from you soon. So, yeah, have a great day.
Thanks, everyone.