Welcome to the Site Drainage Series (1/6)
Major rainfall and storm events are only becoming more frequent, grading schedules are tighter than ever, and regulators aren’t giving anyone a pass on runoff or erosion. Weather-related delays cause an average cost increase of 23.8% and increase project duration by over 25%.
That’s why we created the Site Drainage Series, a six-part series unpacking the hydrology workflows reshaping how forward-thinking contractors plan, build, and protect their projects. To kick us off, we’re tackling one of the most powerful preventative steps you can take: simulating rainfall on your actual site surface to see exactly where the next storm will flow.
When a storm hits, “close enough” isn’t enough
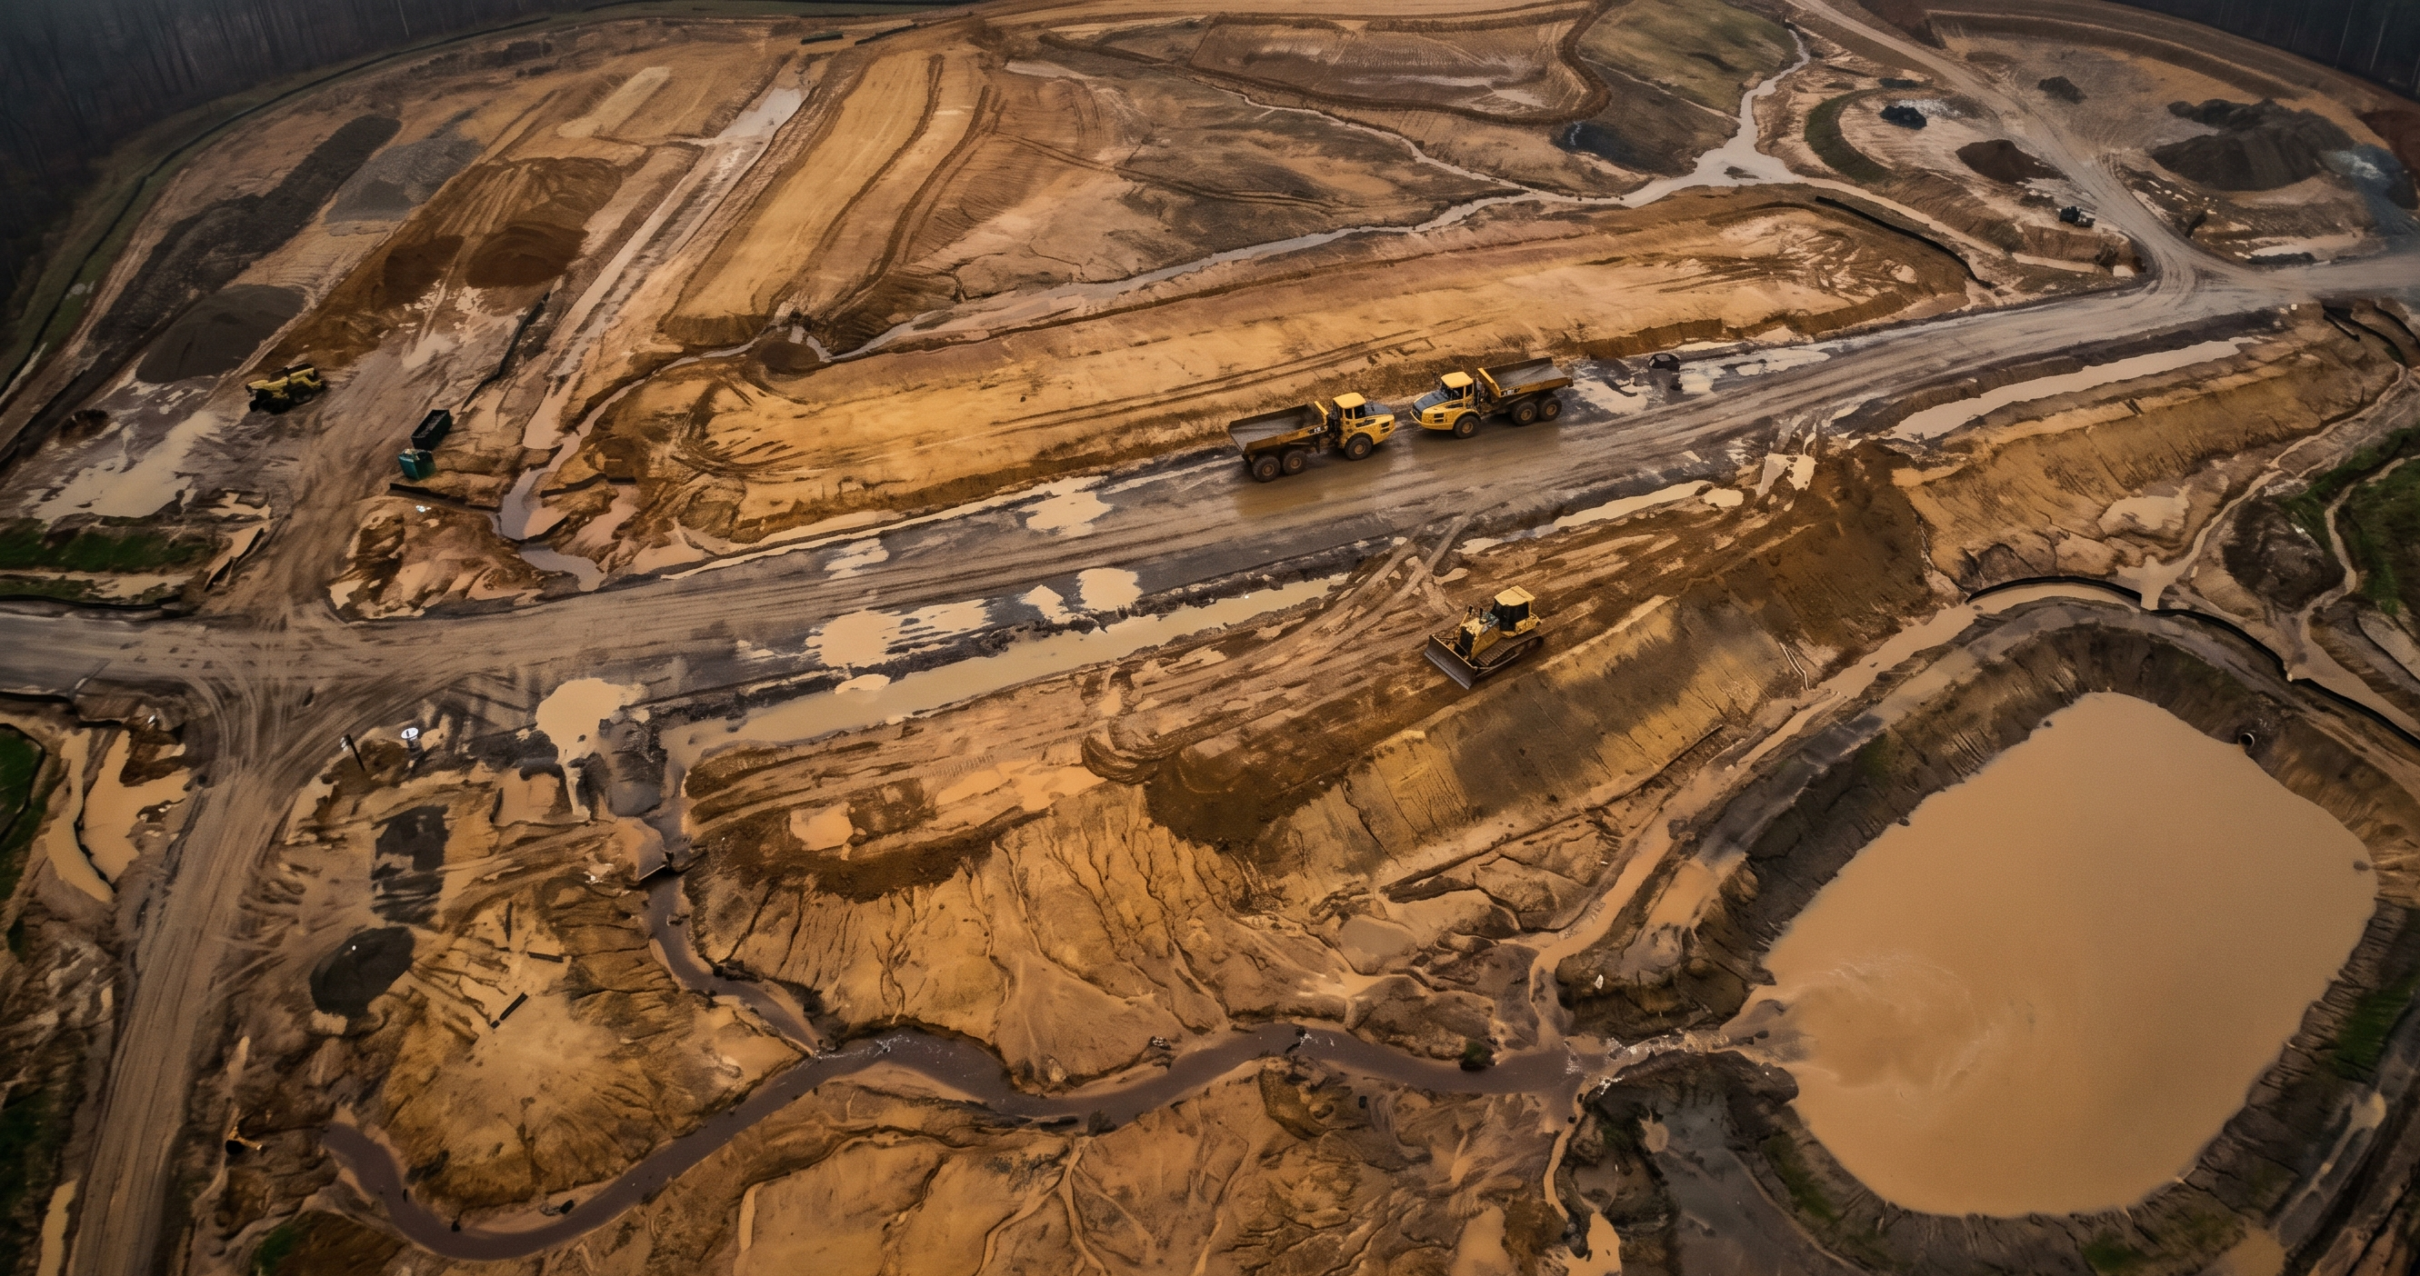
It’s an all-too-familiar story: a Friday night storm drops two or three inches of rain. Nothing unusual for the region—but by Saturday morning, your crew finds the haul road submerged beneath standing water, a slope carved with fresh rills, and a sediment basin overtopping across the property line.
Work is paused for days. Pump rentals, cleanup, and environmental fines add up to tens of thousands of dollars in unplanned spend. Schedule setbacks disrupt the next week of production. All because of one low spot in the subgrade that no one caught until the storm revealed it.
The challenge: Rain doesn’t care about your project plan
Every storm behaves differently, but the consequences are all too predictable: slopes erode and take sediment controls with them, haul routes soften and rut out, and undersized or misplaced inlets get overwhelmed. Crews spend hours on pumpout and cleanup while your schedule falls further and further behind.
The cost of even a small storm can add up quickly. Maximum potential fines and impacts include:
- $1,000 per hour for idle machinery
- $5,000–$15,000 per day for emergency pump mobilization
- 50-plus tons of soil per acre lost on a 3:1 slope during a single storm
- $68,000 per day in fines for uncontrolled discharge
A storm doesn’t need to be catastrophic to derail your week; it just needs to expose one weak point. Most teams don’t know where that weak point is. Until it’s too late.
Why storm damage persists
Hydrology models aren’t new to construction software, but almost none of them run on the latest available site surface. That’s where the disconnect lies. Traditional hydrology models are based on design assumptions; they don’t reflect mid-project topo changes, daily grading adjustments, or mistakes that create disparity between as-builts and design.
Propeller’s rainfall simulation tool lets you use real surface data to predict real outcomes and make real decisions from within a single tool, without exporting your latest site data to hydraulic modeling software.
The fix: Rainfall simulation that runs on your actual survey surface
Rainfall simulation feature summary
- Problem it solves: Teams can’t see how today’s topo will hold up under tomorrow’s storm.
- What it does: Models storm events directly onto your current drone survey or ground topo.
- How it helps: Shows exactly where water will flow, pond, or overtop controls, so crews can fix problems before they start.
[insert gif or video of the tool in action]
Note: More advanced hydraulic models will account for soil types, infiltration rates, and absorption, while Propeller’s hydrology toolkit does not. Our toolkit is focused on a different critical advantage: quick, easy-to-access insights within the site map your team is already using.
4 site drainage questions Propeller helps answer:
- Where will water start moving first?
- Where will it get stuck?
- What will it touch on the way (e.g., roads, benches, controls, site boundaries)?
- What can we do to prevent downtime?
Here’s how Propeller’s rainfall simulation works in practice
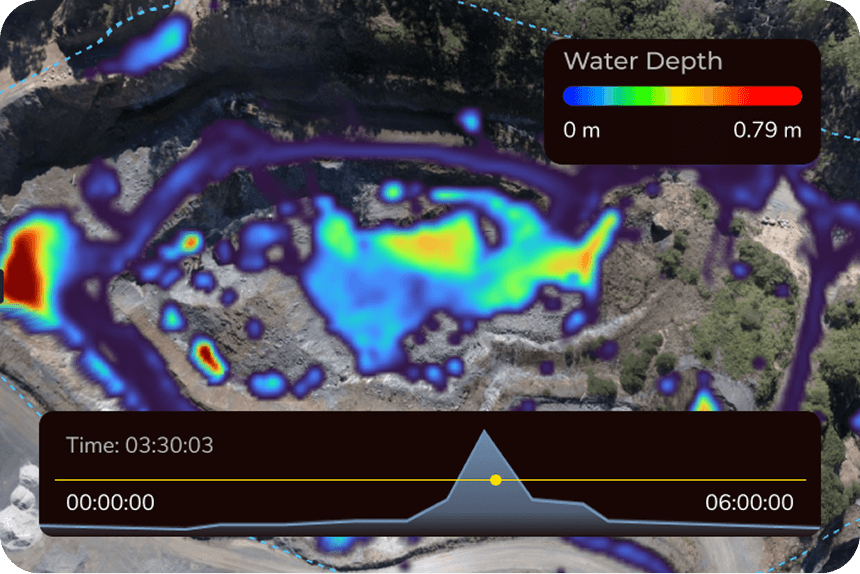
Imagine it’s Thursday morning, and a heavy storm is in the forecast for Friday night. You open Propeller, run the forecast data against Wednesday’s site survey, and see:
- Flow paths converging on a newly cut slope
- Ponding at a critical point on the haul route
- A low spot by the materials laydown area that will pool 6–8 inches of water
Now, you know where to build a temporary berm, which inlet needs extra protection, and where to relocate equipment before the rain hits. Instead of initiating a stormwater cleanup plan on Saturday, you’re putting a checklist into motion ahead of time so work stays on schedule.
[insert gif or video of design changes being made based on rainfall simulation]
What happens without a model?
Soil erosion is estimated to cause $8 billion in global economic losses per year. A poorly placed inlet can trigger a chain reaction where water overtops, mud flows outside the site boundaries, and—before you know it—local regulators are issuing a stop-work order.
The headlines are full of examples where “routine” storms turn into five- or six-figure penalties for contractors, because their stormwater pollution prevention plan (SWPPP) didn’t account for changing topography.
Rainfall simulation lets you fix drainage problems before they become environmental violations or expensive emergency pump rentals.
How rainfall simulation works
- Step 1: Upload your survey. Use drone data, LiDAR, or a ground topo—wherever your latest surface data comes from.
- Step 2: Select rainfall parameters. Choose rain intensity and duration, or upload a local storm CSV.
- Step 3: Run the simulation. Propeller’s Hydrology tool calculates runoff, ponding depth, and flow paths automatically.
- Step 4: Analyze the output. Identify high-risk zones in 3D so you can adjust grading, reinforce controls, or relocate equipment.
[show as much of this workflow as possible in a gif]
Results teams see after rainfall simulation analysis
When the weather becomes something you model and prepare for, you get:
- Reduced labor hours on rework, including pumping water
- Stronger storm-readiness plans
- Better grading decisions
- Less erosion
- More accurate communication with owners and inspectors
- Projects that stay on budget and on schedule, regardless of weather