Site Drainage Series (4/6)
So far in our Site Drainage Series, we’ve covered how to:
- Model storms before they arrive
- Map which watersheds will be impacted
- Spot runoff issues before they spread
But there’s another issue that concerns work crews on-site, especially when lives, equipment, and schedules are all on the line: If the site floods, how high could the water actually get?
That’s the question Propeller’s flood-to-level analysis answers.
The challenge: Your site changes faster than flood maps do
Traditional floodplain maps are useful for long-term planning, but they weren’t built for active construction or extraction sites that change constantly. They don’t account for:
- Daily grading changes
- Evolving pit geometry
- Temporary berms or haul roads
- New low points or stockpiles created mid-project
On large sites in particular, those changes are constant. Flood risk is a moving target, and relying on static data in a dynamic environment like this can create serious risk.
Where safety, uptime, and compliance collide
Flooding on-site isn’t just a source of project delays; it’s dangerous. In mines and quarries in particular, uncontrolled water accumulation can cut off pit access, submerge equipment, destabilize slopes, and put your crew at risk.
From a compliance standpoint, floodwater that overtops controls or leaves your site boundary becomes uncontrolled discharge, which means inspections, documentation requirements, and potentially serious fines.
The fix: Quantify flood risk on your actual site surface
Flood-to-level analysis lets teams quantify flood risk on the site they’re working on today—not the one they planned months ago.
Flood-to-Level feature summary
- Problem it solves: No easy way to visualize how high water could rise on an active site as terrain changes.
- What it does: Models potential water accumulation based on surface elevation.
- How it helps: Lets teams move equipment and reinforce controls before water reaches critical areas.
Floodplain maps will tell you whether an area has flooded historically, but flood-to-level analysis answers a more immediate operational question: What happens if water accumulates here tomorrow? That distinction matters when terrain is changing weekly and decisions need to be made fast.
Where more advanced hydraulic models will account for soil types, infiltration rates, and absorption (which Propeller’s hydrology toolkit does not), Propeller offers a critical advantage: quick, easy-to-access insights within the site map they’re already using.
4 site drainage questions Propeller helps answer:
- Where will water start moving first?
- Where will it get stuck?
- What will it touch on the way (e.g., roads, benches, controls, site boundaries)?
- What can we do to prevent downtime?
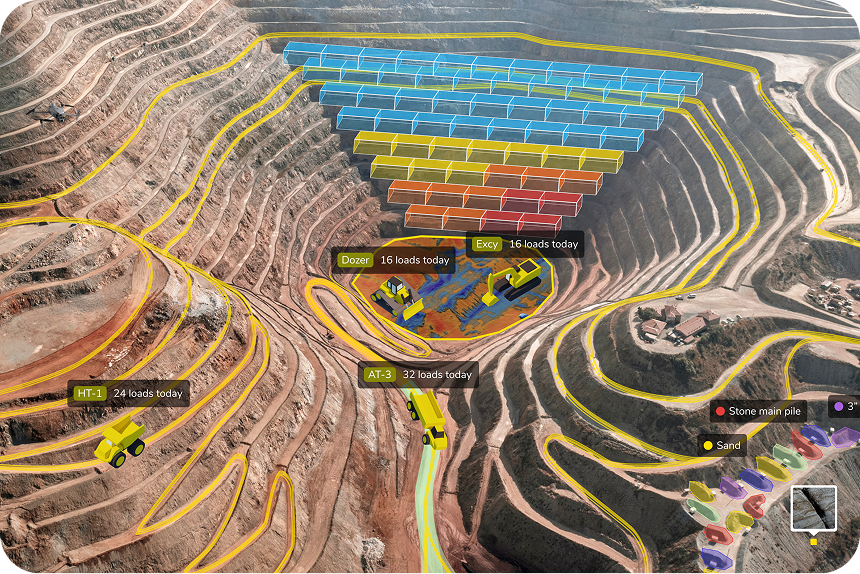
How Propeller’s flood-to-level feature works in practice
At a mine, a pit floor sits below surrounding benches. A new low point was created near the active face after recent excavation. Using flood-to-level analysis, the crew can see that under heavy rain, access ramps would be cut off early, and equipment that’s staged too low would become inaccessible.
Armed with that information, the crew can adjust grading near the pit floor and relocate equipment to higher ground. They can even stage pumps in advance, depending on the forecast. When the storm arrives, they can avoid days of downtime and keep their equipment (and the entire crew) safe.
How flood-to-level analysis works
- Step 1: Upload your survey. Upload your most recent site surface data, whether that’s a drone survey, ground topo, or LiDAR.
- Step 2: Define your flood scenario. Set storm intensity, return period, and water level assumptions.
- Step 3: Run flood-to-level analysis. Propeller calculates water depth and extent across your worksite.
- Step 4: Analyze the output. Review results in 2D and 3D to see which areas flood first and how water spreads, so you can identify critical thresholds and take preventative action.
Results teams see after using flood-to-level analysis
With hydrology data at their fingertips, teams can spot and plan better, leading to:
- Safer pit and low-area operations
- Faster post-storm recovery
- Fewer surprise shutdowns and regulatory violations
- Reduced emergency dewatering
- More confident storm response planning