Site Drainage Series (2/6)
In Part #1 of our Site Drainage Series, we showed you how rainfall simulation lets you preview the impact of the next storm before it hits your site. But storms don’t cause problems on their own, your site’s terrain plays a part, too.
That’s why watershed analysis is the logical next step. If rainfall simulation shows the progression of the storm, watershed analysis reveals its consequences. Read on to learn how you can take preventive steps to prevent flooding and overtopping before you’re on the wrong side of regulators and managing days or weeks of unplanned rework.
Water doesn’t follow your site boundary
Every part of your worksite drains somewhere. Unless you’re proactively mapping it as work progresses, you’re often left guessing where that “somewhere” is, and it probably includes topography outside your site boundary.
Fresh cuts and fills create new drainage patterns, and drainage controls that made sense last month may be completely misaligned today. That’s where Propeller’s watershed analysis becomes essential.
The challenge: Drainage patterns change faster than designs do
Hidden flow paths create some of the most expensive failure points on a work site:
- Misaligned berms → gully formation: Even a well-built berm is useless if it’s not intercepting actual flow.
- Undersized check dams → overtopping: A catchment can shed 50 tons of soil per acre (or more in extreme cases) in a single storm.
- New micro-catchments after cut-fill operations: Fresh cuts commonly create new low points and drainage pockets.
- Design assumptions that no longer match current grading: Designs often show drainage areas that don’t match current site conditions.
Problems like these can chew up budgets, stress your crew, and wreak total havoc on compliance plans.
The fix: Automatically map catchments and flow paths
Watershed Analysis feature summary
- Problem it solves: Teams can’t see true contributing areas to site flooding and erosion, especially after grading changes, leading to misplaced controls.
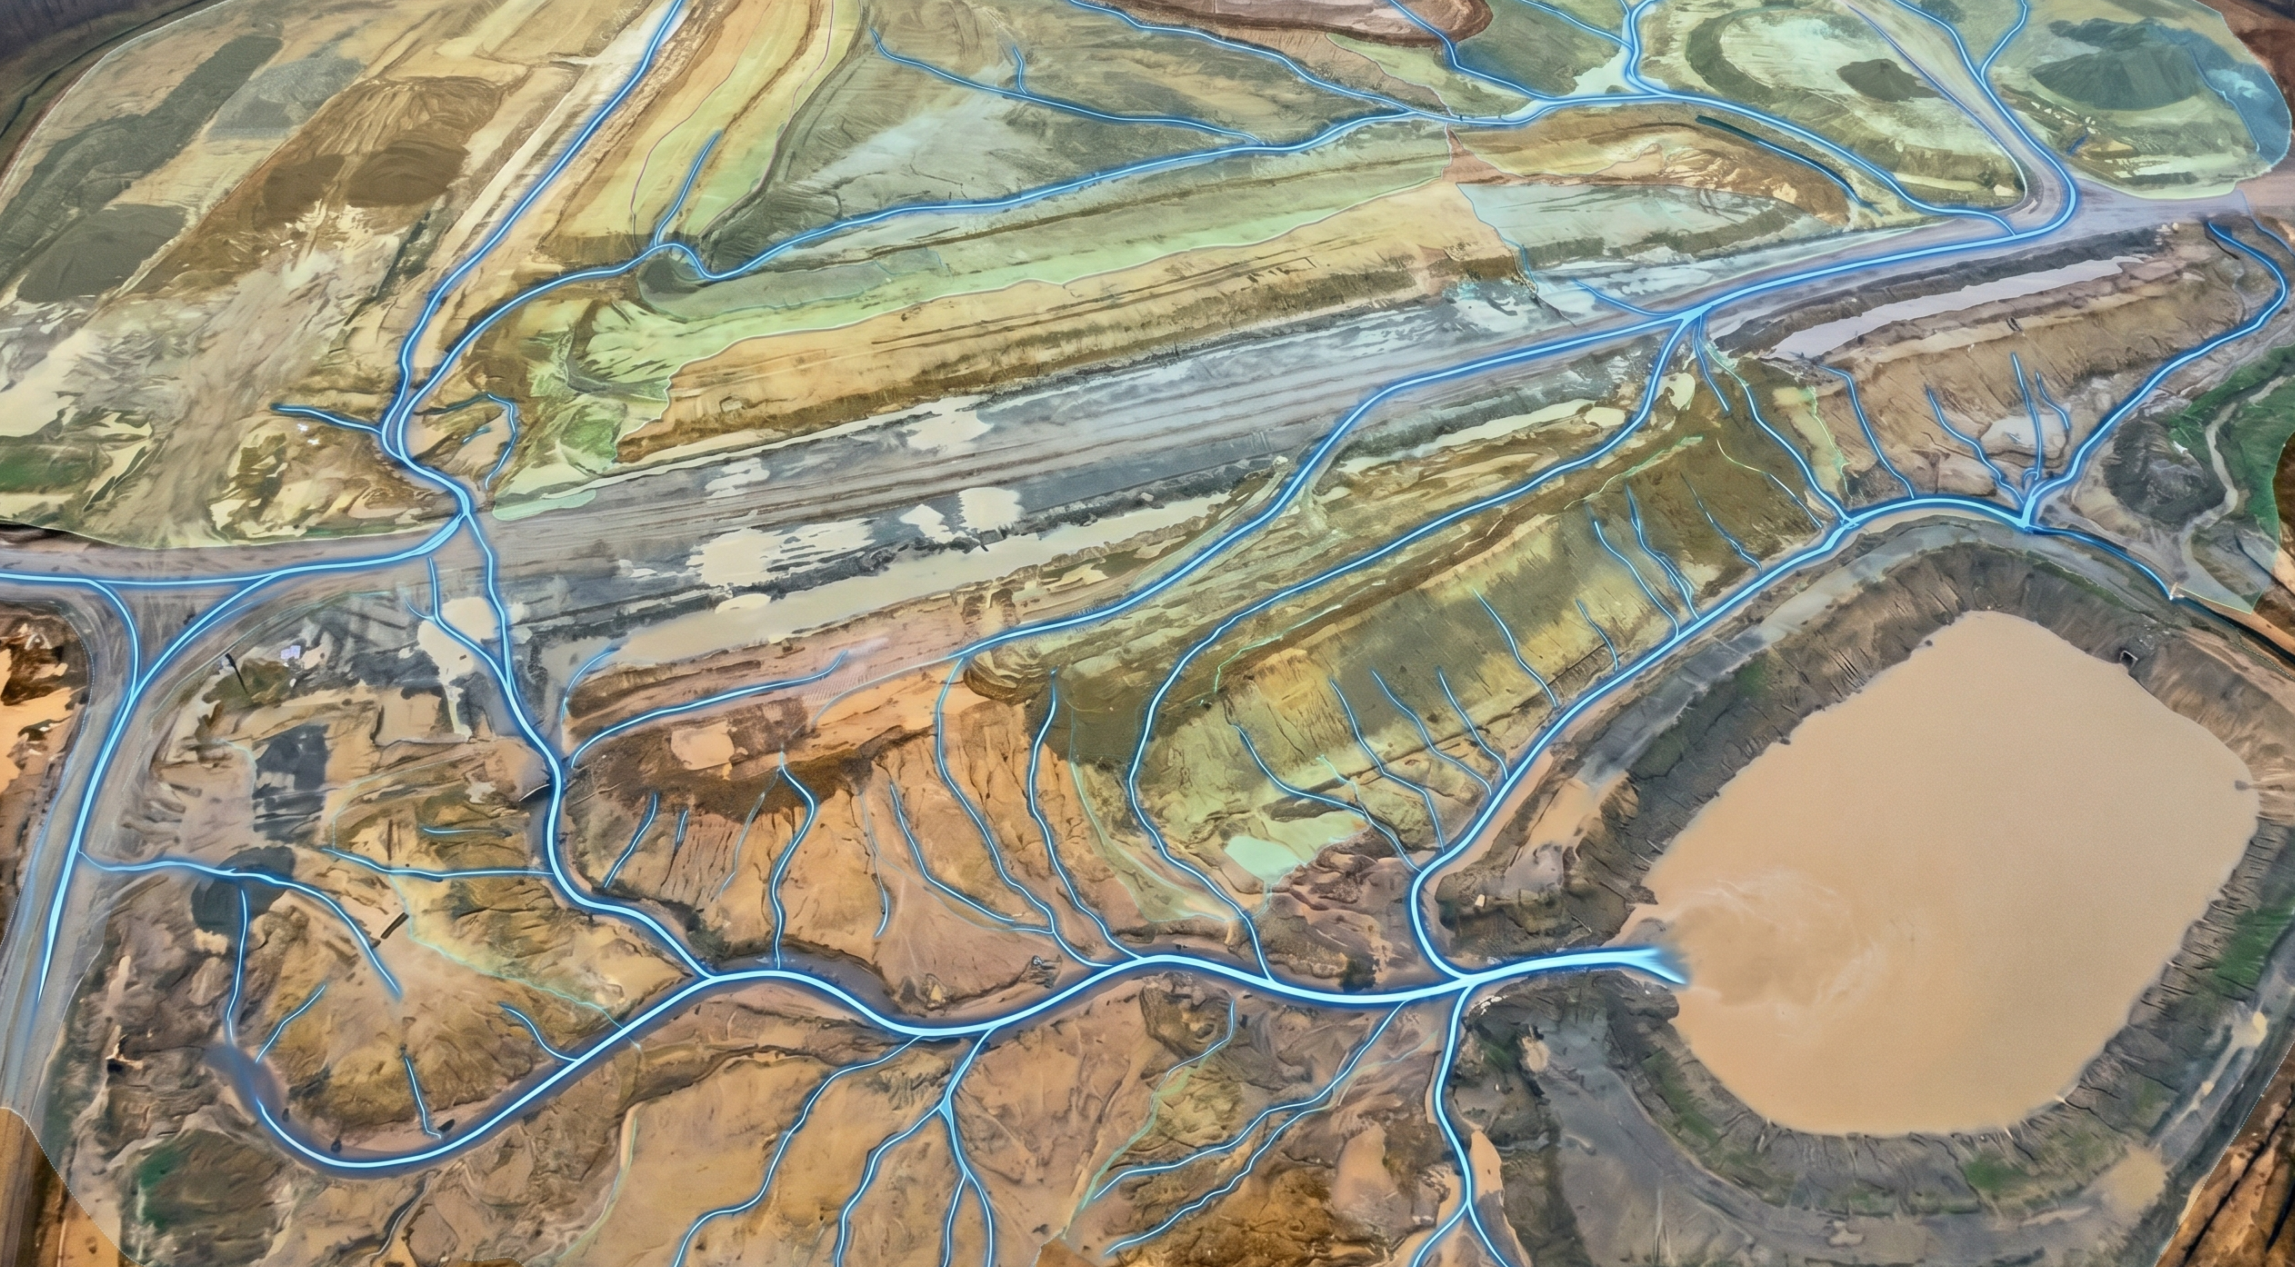
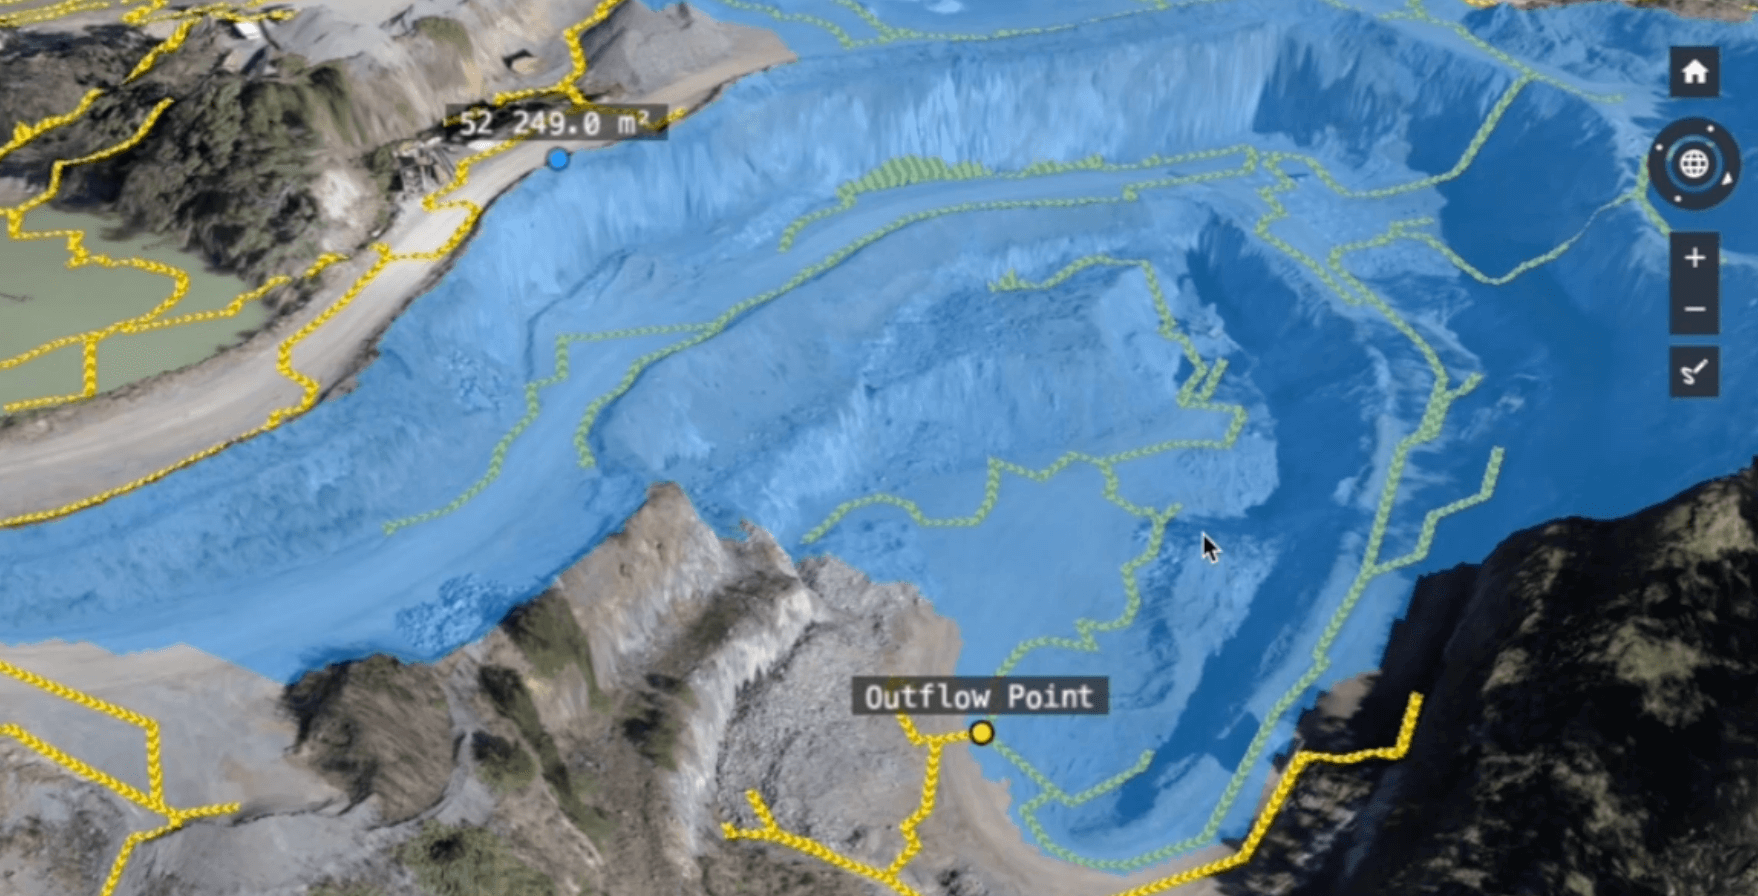
- What it does: Automatically shows each catchment on your latest survey and maps surface flow paths in 2D and 3D.
- How it helps: Shows where water travels, collects, or exits the site, so erosion and drainage controls match real-world conditions.
Note: More advanced hydraulic models will account for soil types, infiltration rates, and absorption, but Propeller’s hydrology toolkit doesn’t get that complex. Instead, we’re focused on providing quick, easy-to-access insights within the site map your team is already using.
4 site drainage questions Propeller helps answer:
- Where will water start moving first?
- Where will it get stuck?
- What will it touch on the way (e.g., roads, benches, controls, site boundaries)?
- What can we do to prevent downtime?
How Propeller’s watershed analysis tool works in practice
Let’s say you’ve just completed a major cut-fill operation. The design plan shows three drainage areas of note, but your most recent site survey shows five. Through watershed analysis, you can see that there’s a low point contributing to an inlet that wasn’t designed to handle that kind of volume. You also spot a flow path bypassing an existing check dam.
With this information in hand, you can:
- Add a berm in the right spot to intercept flow
- Resize or relocate a drain
- Realign silt fences before they fall in the next storm
Without an updated hydrology surface model based on current site data, you’d likely discover all of this from the field, after the damage was done.
The financial impact of erosion (and why it matters)
Last week, we noted that soil erosion is estimated to cause $8 billion in global economic losses per year. In other words, every cube of material that’s moved by the rain (and not by your crew) adds up!
Here’s a look at how water-related issues can snowball fast:
- Cleanup costs: Sediment cleanup, slope rework, pumpout efforts, and haul road repair can easily exceed $200k for a mid-sized event.
- Downtime: Idle equipment can cost thousands per hour, not to mention the cost of storm response labor allocated outside your project plan.
- Regulatory risk: EPA fines for uncontrolled discharge can reach up to $68,000 per day.
Compare that to running a watershed analysis in minutes, plus the cost of preventative berming or regrading. One workflow can easily save tens of thousands in unplanned spend.
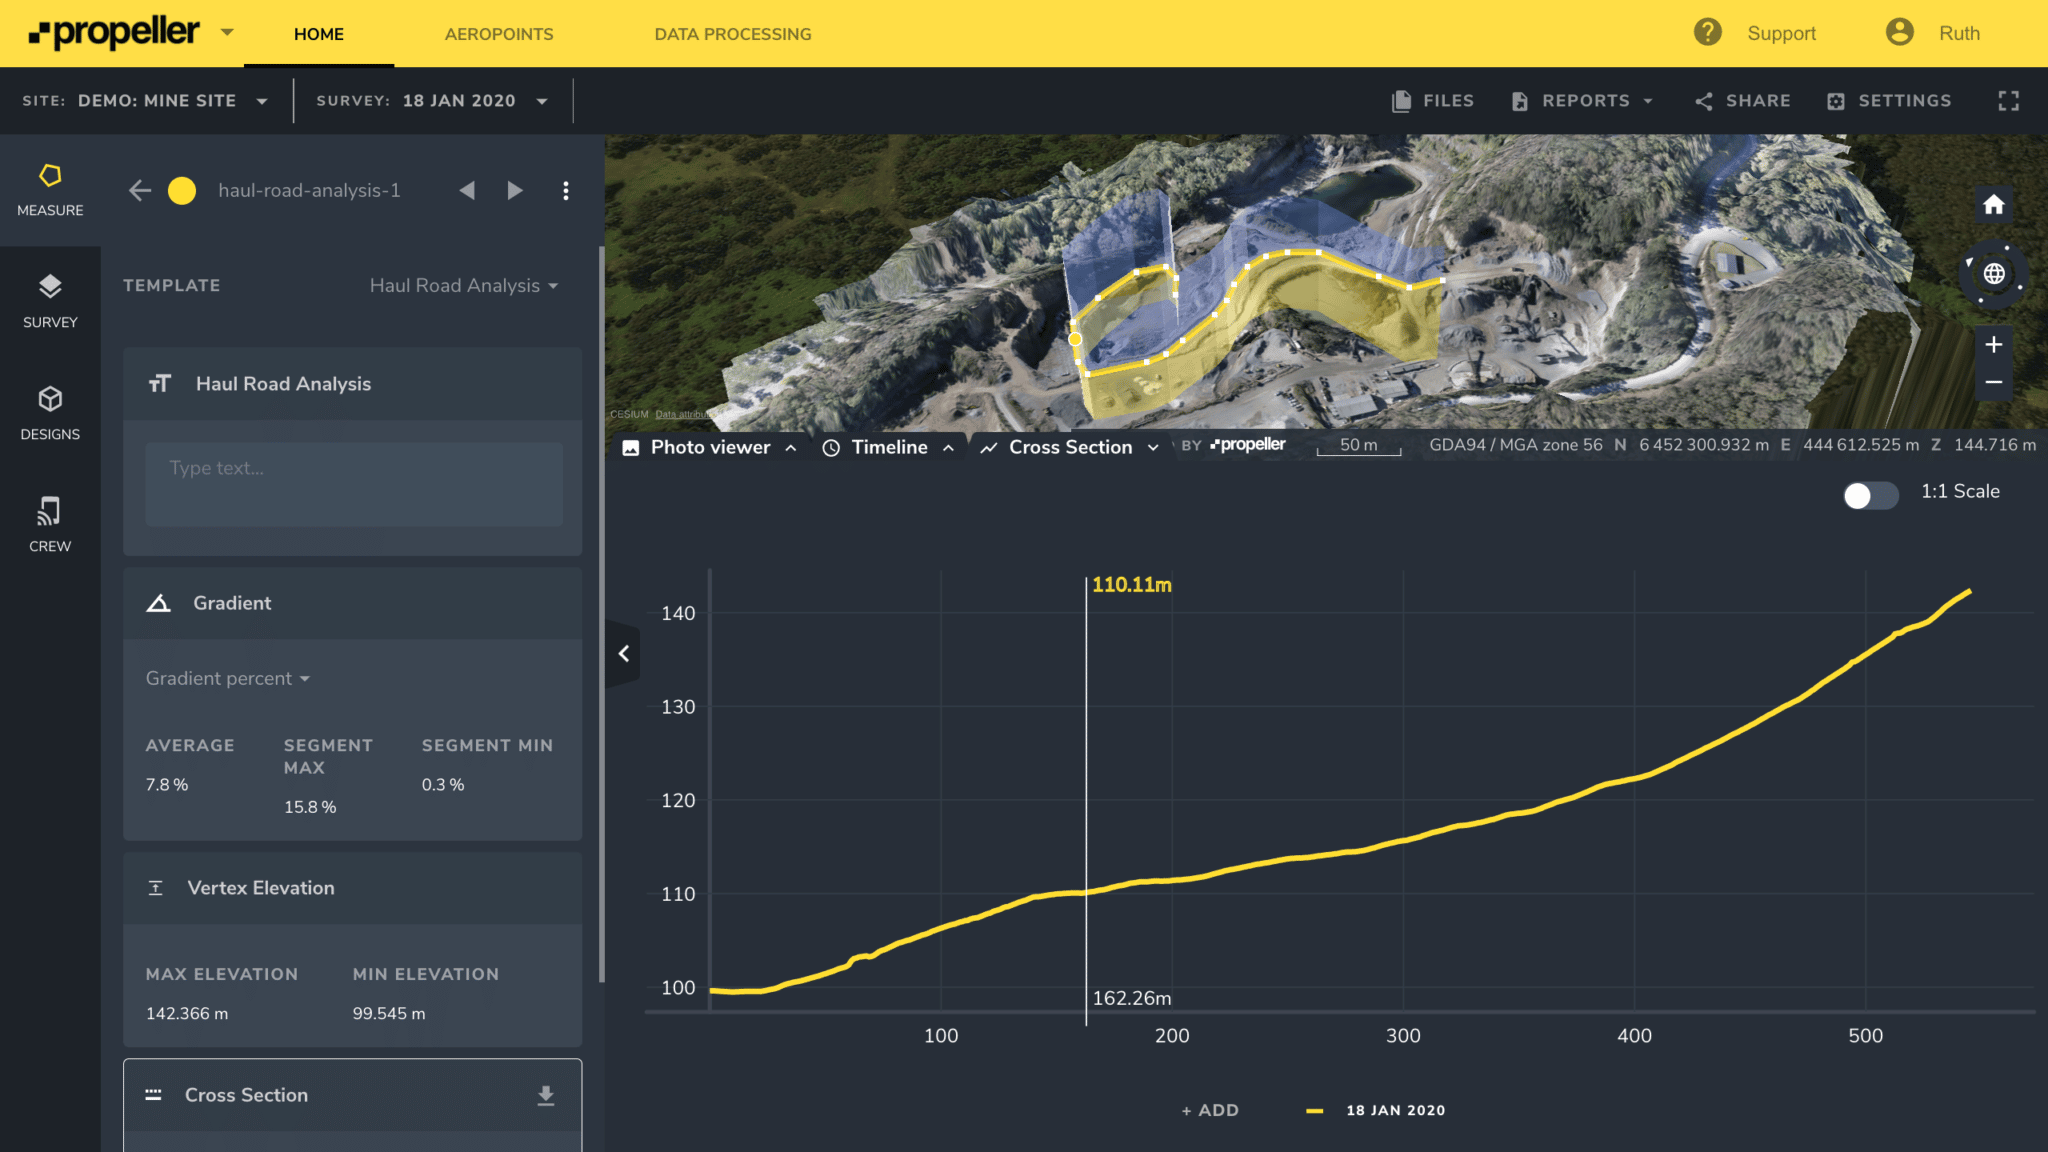
How watershed analysis works
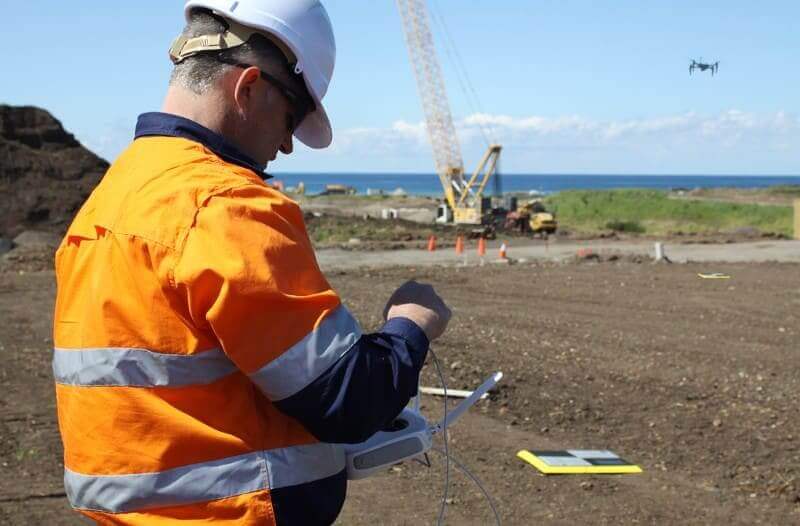
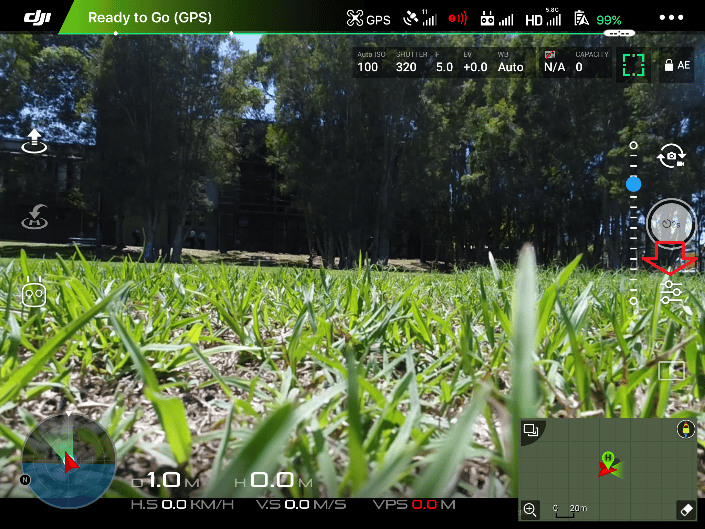
- Step 1: Upload your survey. Use drone data, LiDAR, or a ground topo to import the most recent surface data.
- Step 2: Run watershed analysis. Catchments and flow paths calculate automatically.
- Step 3: Review in 3D. See how your site truly drains, including slopes, depressions, and micro-basins.
- Step 4: Analyze the output. Ensure your controls align with reality, and use them to update SWPPPs or grading plans.
Results teams see using watershed analysis
When the weather becomes something you model and prepare for, you get:
- Reduced labor hours on rework, including pumping water
- Smarter grading decisions
- Better control placement
- Fewer surprises after a storm
- Lower rework and sediment cleanup costs
- Better documentation for compliance audits
Turn your evolving worksite into a clear drainage system your entire team can understand (and plan work around).