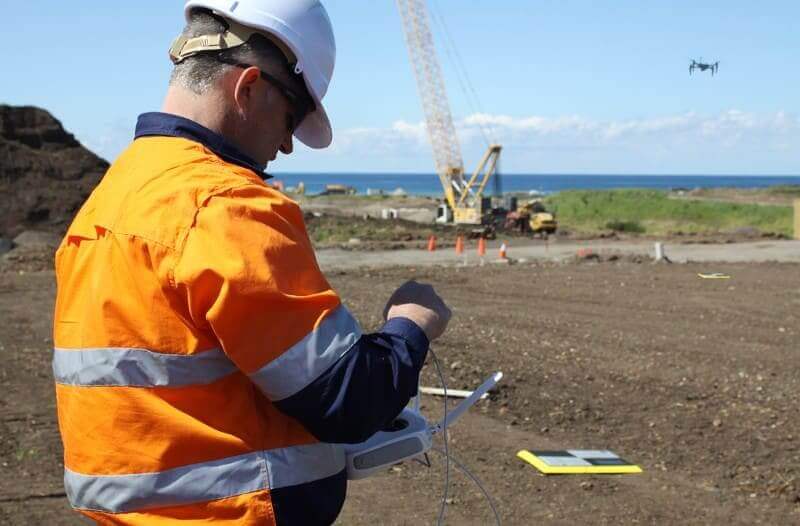
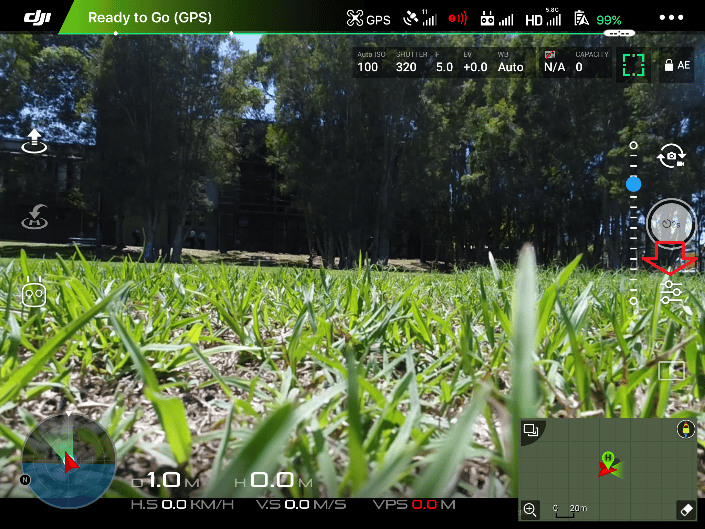
With new tools like RTK-enabled drones for surveying, capturing site data is becoming easier and easier, which means you’re also capturing data more often. This increase can help you track quantities and monitor progress, but it’s also a key factor in better tracking safety hazards on your worksite.
Frequent surveys give you the opportunity to spot hazards and detect irregularities, fissures, and potential slips before they become a problem. With a data analytics and visualization platform like Propeller, you can create a paperless, precise visual record of site hazards, road grades, and berm heights that can easily be tracked and shared with your team.
Here, we’ll cover how you can use on-screen tools to do checks and use existing site data to better record worksite conditions.
Check berm heights in a few clicks
Ensuring berms are the correct height is a common safety check. Propeller has a Safety Berm Check template that lets you measure the berm and classify it for others.
In just a couple of clicks, you can visualize the measurement in 3D and change the color of the measurement to indicate higher safety risks.
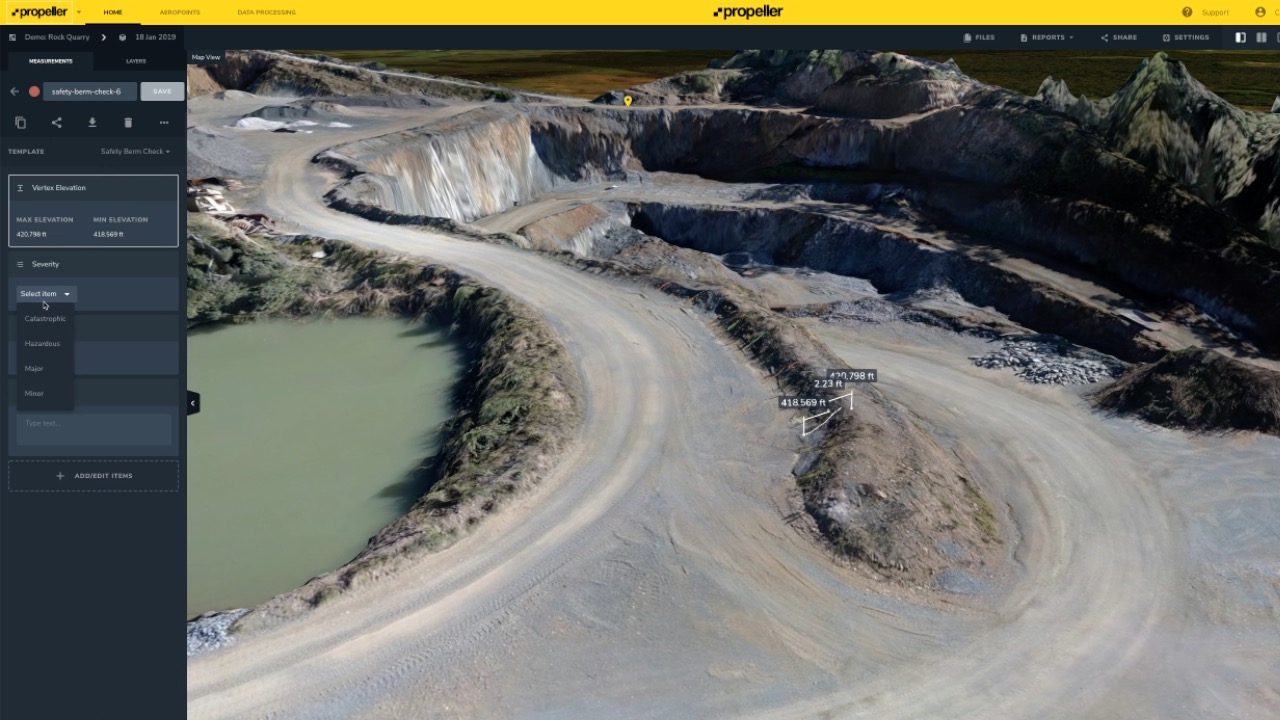
You can also select the severity and likelihood of the hazard to capture vital safety information on screen, in addition to making notes or adding comments to provide additional context when sharing with your team.
Measure road grades across your entire site in seconds
The size and weight of on-site vehicles, the road surface, drainage, and erosion are all factors to consider when it comes to ensuring the roads are safe and compliant.
Propeller Sales Engineer Kevin Smith has a quick and easy way to check the gradient of all roads on site at once. Here’s how.
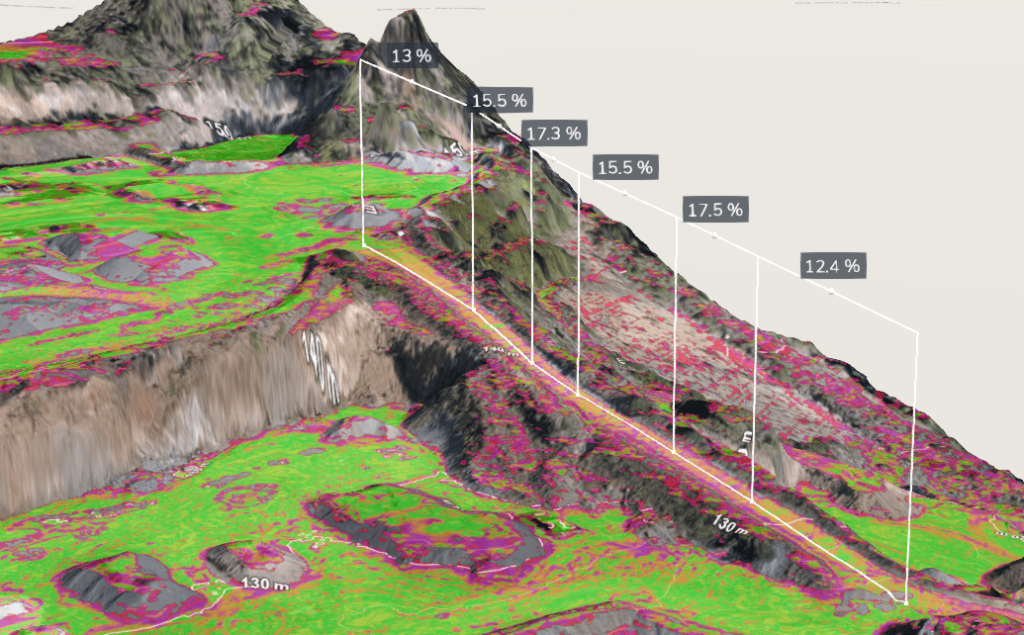
In Propeller, you can turn on a gradient map for the entire site in one click. This automatically colorizes standard grades.
“Once you’ve selected the gradient layer, you might not see much difference to start with, but you can customize it to show what you actually want,” said Smith. “We know roads aren’t going to be greater than about 40%, so start by setting the gradient ranges and colors to highlight the potentially hazardous roads.”
Once you’ve applied that those conditions, you can zoom in and quickly spot the areas and roads that are too steep.

If you see a road that looks too steep, you can check it individually to see the exact grade using use the Line Tool. “This is a really easy way to see and check all of the roads on the entire site,” noted Smith.
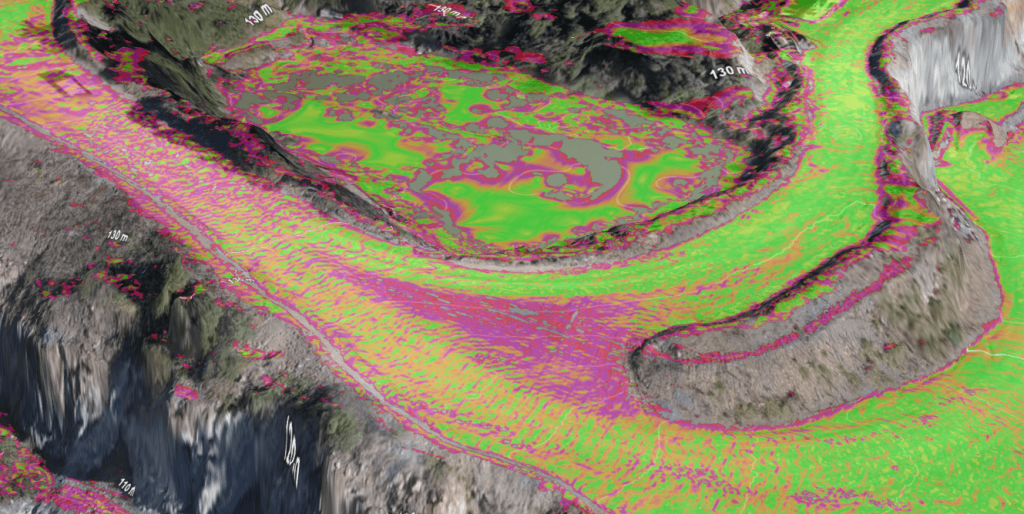
“Another benefit is that this layer not only shows you roads that are too steep, but also allows your to quickly identify potentially hazardous cambers, giving you the opportunity to quickly identify areas that require leveling off or avoiding,” said Smith.
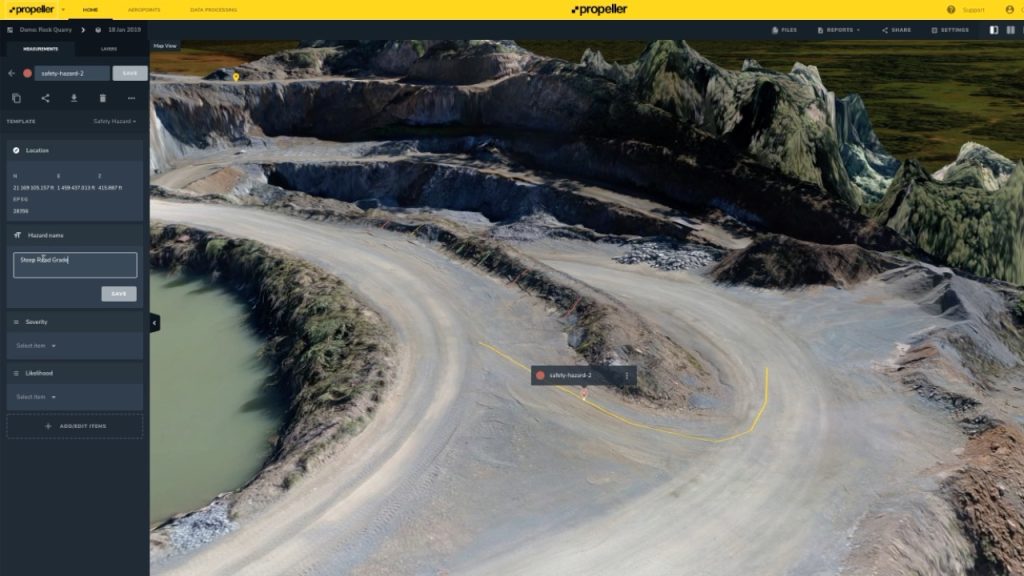
Mark and log a specific hazard on site to inform your team
All the tools mentioned above help spot and diagnose existing or potential hazards. Another key step is to notify and mark safety concerns on site. This is done in the physical world with easy-to-see markers, but you can do the same with your 3D survey map.
You can point and click to select a specific location anywhere on your map and label it. For example, marking the area of the road that was too steep means clicking at that location. You automatically get coordinates and dropdown lists to capture safety information.
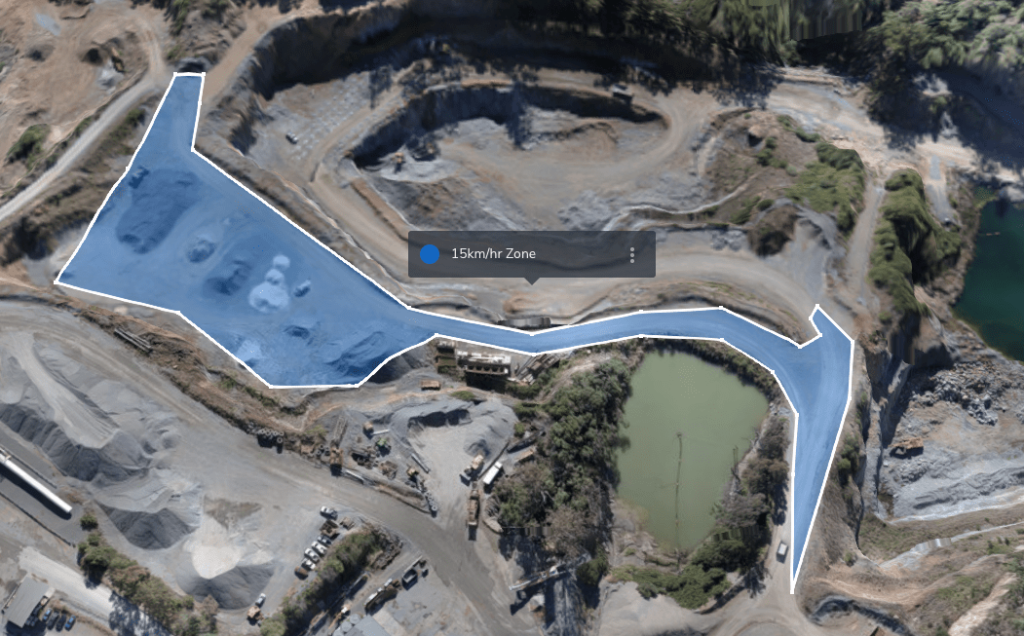
But sometimes your no-go areas are larger than specific points or features. You can highlight those areas around site, like the visitor parking lot, slow-speed zones, or open trenches where people should be careful.
These areas can easily updated by adjusting the boundaries using the latest drone survey, and because you can promote it to Site level, it’s easily visible for the whole team.
Exporting and sharing safety hazards with your team
All of this painstaking recording and tracking has the biggest impact when shared with key stakeholders and team members. Notification is as simple as sending an email or sharing a link.

You can also share an in-depth report on specific or all safety hazards. Just search for “safety” in the search bar, and it will bring up a up related measurements.
Select the measurements you want to share and generate a report in PDF or CSV format. A PDF report includes an overview of each measurement as well as the specific information you added, like comments or severity information.