Mapping success: The art of data sharing with Propeller

Map export in Propeller

Mapping success: The art of data sharing with Propeller

At Propeller, we believe the best outcomes are born from collaboration. And what better tool to facilitate that level of teamwork than a 3D map? After all, the map doesn’t just translate your survey data into visuals that reflect your reality—it brings teams together.

By transforming complex survey data into accessible, interactive maps, we’re creating a common ground where internal and external teams can connect, communicate, and get the answers they need.

In this post, we’ll explore how our data-sharing tools empower teams to navigate project challenges more effectively, keeping everyone from the field to the office in the loop.

Propeller’s raw data exports and analytics

The ultimate purpose of surveying a site is to gather actionable data about its conditions. What do the grades look like now, and how does that compare to design? How much work is complete, and how much is left to go?

While photorealistic maps can be useful in answering these questions, sometimes you just need the numbers. If number-crunching and data-seeking speak to you, our robust export options and built-in analytics have you covered.

Export your data to CSV or PDF for essential progress insights, efficiency metrics, and inventory updates, all available to use and share whenever you need them. 

Takeoff Reporting and survey exports


Internal team members can log in and make calculations or run their own analytics, from measuring stockpiles to checking remaining airspace at a landfill. This level of direct access relieves surveyors and project managers, who are often tasked as gatekeepers of project data.

Exports are available too, including orthophotos, point clouds, and topos. These raw data types can be shared with anyone for external analysis or uploaded into a CAD or GIS system. 

The file types available for download and export include:

  • Surfaces (DXF, TTM, GeoTIFF): Essential for in-depth surface analysis, surface files help map highly variable surfaces and represent how those surfaces change throughout the course of a project.
  • Contours (DXF): Lines connecting points of equal elevation to help better understand the terrain and prepare for future site work.
  • Orthophotos (GeoTIFF, JPEG, JP2, PNG, KML): Export an orthophoto from any polygon measurement to carry out further work. Orthophotos are available in different formats for detailed aerial views.
  • Point clouds (LAZ, LAS, CSV): Used for advanced classification and editing using specialized tools, point clouds are especially valuable for calculating volume because the points comprise horizontal and vertical spatial data.

Want a more in-depth look at the different exportable data types and how our customers use them? Check out this post.

How to use data exports and built-in reporting

Share data with clients

If your clients use their own analytics tools to analyze data, you can send them CSV exports or PDF reports, making it easy for them to track progress without gaining direct access to your project.

Project planning and progress monitoring

Propeller data exports help you plan your earthwork projects, track material inventories, and monitor progress throughout the project lifecycle. Choose from a range of export types to share data that clarifies the details of your project, such as stockpile volumes

Compare cut-fill

Compare cut-fill data against design by generating take-off reporting within Propeller, which yields accurate cut-fill quantities and shows how close you are to balance. From there, you’ll clearly see what work has been done and what’s left to do so you can make a plan that keeps you on schedule and on budget. 

Provide user access

Project managers need an easy, quick way to share data with engineers, foremen, and surveyors. Many users give their full team direct access to Propeller so they can log in and view the data, download it, or even complete their own calculations. (More on granting users specific permissions later in this post.)

Visual data sharing in Propeller

Imagine describing a complex worksite using only raw data and your words. Now, imagine showing it. 

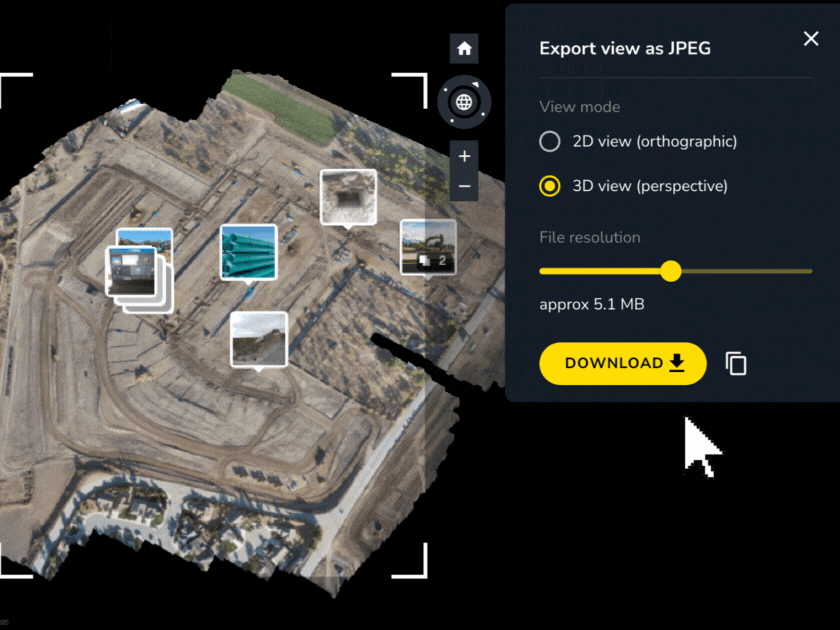
With Propeller, visual export options transform abstract data into concrete understanding. From JPEGs and MOV files to GIFs showing every stage of a site’s evolution, our visual tools make every meeting more productive and every project phase clearer.

Planning Manager Mats Nyland put it this way: “If you have ten people sitting in a room imagining what I’m talking about when I describe a project, you probably have ten different stories afterward. But if they can see it, they can understand it.”

Propeller’s visual reporting is inherently customizable, allowing you to show and share as much or as little as you want to. Using dynamic exports, you can clip out specific areas of a site to keep attention focused. Or share the whole project for a bird’s-eye view.

Visual export options include:

Site maps: Export site maps in 2D or 3D as JPEGs, viewable on any device by whoever you share them with. 

Export site map image in 2D or 3D in Propeller


Fly-through videos: Create and share a visual fly-through of your worksite as a video file (MOV). 


Timelapse videos: Create a timelapse video to easily and quickly share vital updates to stakeholders on your site’s progress over time. This video will cycle through previous surveys you select to show how your site (or even a small area) has changed over time.


These exports are time- and date-stamped and branded with your company name and logo, making them easy to share with clients.

Visualizing data outside Propeller

If you prefer to visualize your site data in your own tools—or if you work with stakeholders who do—we have a solution for that, too. 

You can download your 3D model, point cloud, orthophoto, or terrain files for manual upload into other tools. Or, send them over directly using Propeller’s direct integrations

Propeller Integrations

We even offer a WMTS integration that lets you create a direct link to your site’s orthophoto, pulling it directly into GIS software to view it without physically downloading or migrating any data.

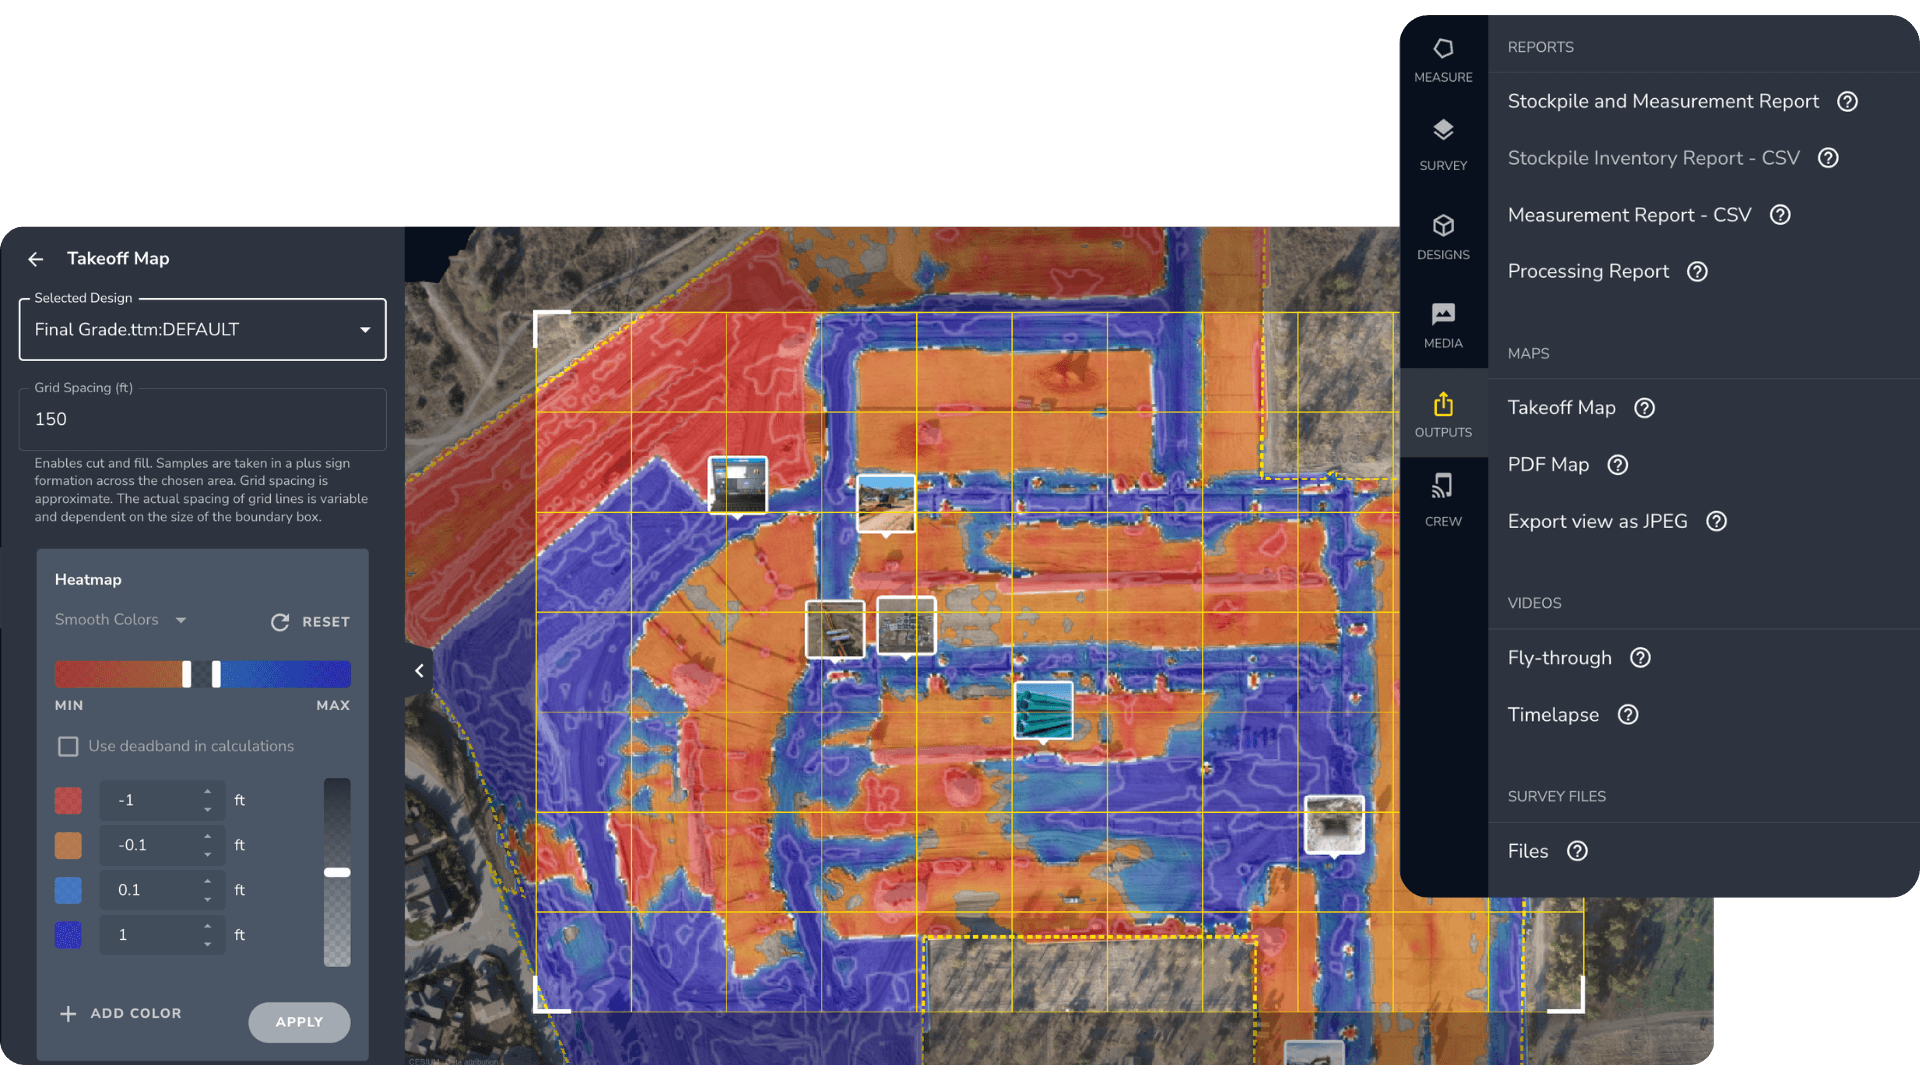
How to use visual data exports 

Proof of work

Visualized data is especially helpful for showing proof of work with cut/fill reporting, ensuring everyone pays (and gets paid) for the earth that actually got moved. Subcontractors can attach a JPEG or video file of their work alongside invoices to justify their charges. On the flip side, general contractors can verify that subcontractors are invoicing for the correct quantities.

Dispute resolution

Finger-pointing tends to be endless if there’s no verifiable evidence of what’s true. Propeller’s visual reports and proof of work over a project’s lifetime help prevent disputes before they start, mitigating the risk of any stakeholder claiming that work wasn’t completed according to plan.

Enhancing bids

Anyone who’s ever created a bid knows that accurate original ground files can be hard to come by. With Propeller, you can fly a site before it’s been cleared (even using lidar for densely vegetated sites) to verify current ground conditions. If there’s a discrepancy, you can compare your drone flight to the grading plan to generate the actual volume of earth that should be moved and create an accurate bid. Visual reporting provides a justification for any volumetric differences, helping you protect your margins and win more bids.

Functional sharing in Propeller

When you want internal users to transition from just seeing your survey data to engaging with it, you can do that in two ways: user permissions and the mobile app.

Granting need-to-know access with user permissions 

We have a diverse set of user permissions, from view-only to full edit capabilities, to make it easy to share your project data with as many people as possible securely. 

Project administrators can grant specific access to various stakeholders or stick with the export functions described above, depending on the user and their role in a project.

The levels of user access include:

  • View: All users invited to Propeller get view-only access by default. This is the most restricted level of access, allowing users to see only the map itself. View-only users can see the map but can’t see designs, measurements, or reports.
  • Inspect: View measurements, designs, survey files, terrain cleanups, and photos. No ability to create, edit, or export data unless the Export permission is added.
  • Export: Allows users to export any data on a site they can access, including survey data. They can also generate reports and export measurements.
  • Measure: Allows users to create, delete, and change measurements in Propeller.
  • Edit: Edit designs, upload files, and change site settings.
  • Edit media: Upload, edit, and comment on site-related media.
  • Process: Upload survey data for processing and edit any terrain.

Other permission levels allow users to manage access, create workspaces, or administer Propeller for their organization.

user permission settings in Propeller platform

Making moves in the field with Propeller’s mobile app

Using our mobile app, field personnel can make real-time calculations and add contextual data directly from the worksite.

Authorized users who’ve been added to a project (foremen, for example) can bridge the gap between the office and the field by making real-time calculations in our mobile app. They can also calculate stockpile volumes or cut/fill quantities while on-site without having to ping anyone in the office or grab a laptop.

They can also use the app to identify their exact position on the map, adding photos and notes if they need to flag any issues or follow up on outstanding tasks. 

Keep your stakeholders on the same page

With Propeller serving as a single source of truth for all project stakeholders, everyone from foremen to project managers can get the information they need without waiting on a specialist.

Raw data exports enable calculations and analytics, while visual reporting brings a shared understanding of your worksite to a whole new level. And when users need to engage with the data and do a bit more, we’ve got you covered there too.

With more transparency into what’s happening on-site, teams are better equipped to track progress, improve productivity, plan efficiently, and mitigate risk. 

Ready to learn how Propeller can power up your worksite with easy and effective data-sharing? Request a demo today.

Share

We’re happy to show you how Propeller can power your worksite, and boost productivity. Simply request a demo now.

Subscribe to our newsletter

Get the latest from Propeller, including industry news, customer stories, webinars, videos, and more.

You may unsubscribe from these communications at any time. For information on how to unsubscribe, as well as our privacy practices and commitment to protecting your privacy, please review our Privacy Policy.