Your pay app isn’t getting stuck because you’re wrong. It’s getting stuck because no one can validate it quickly.
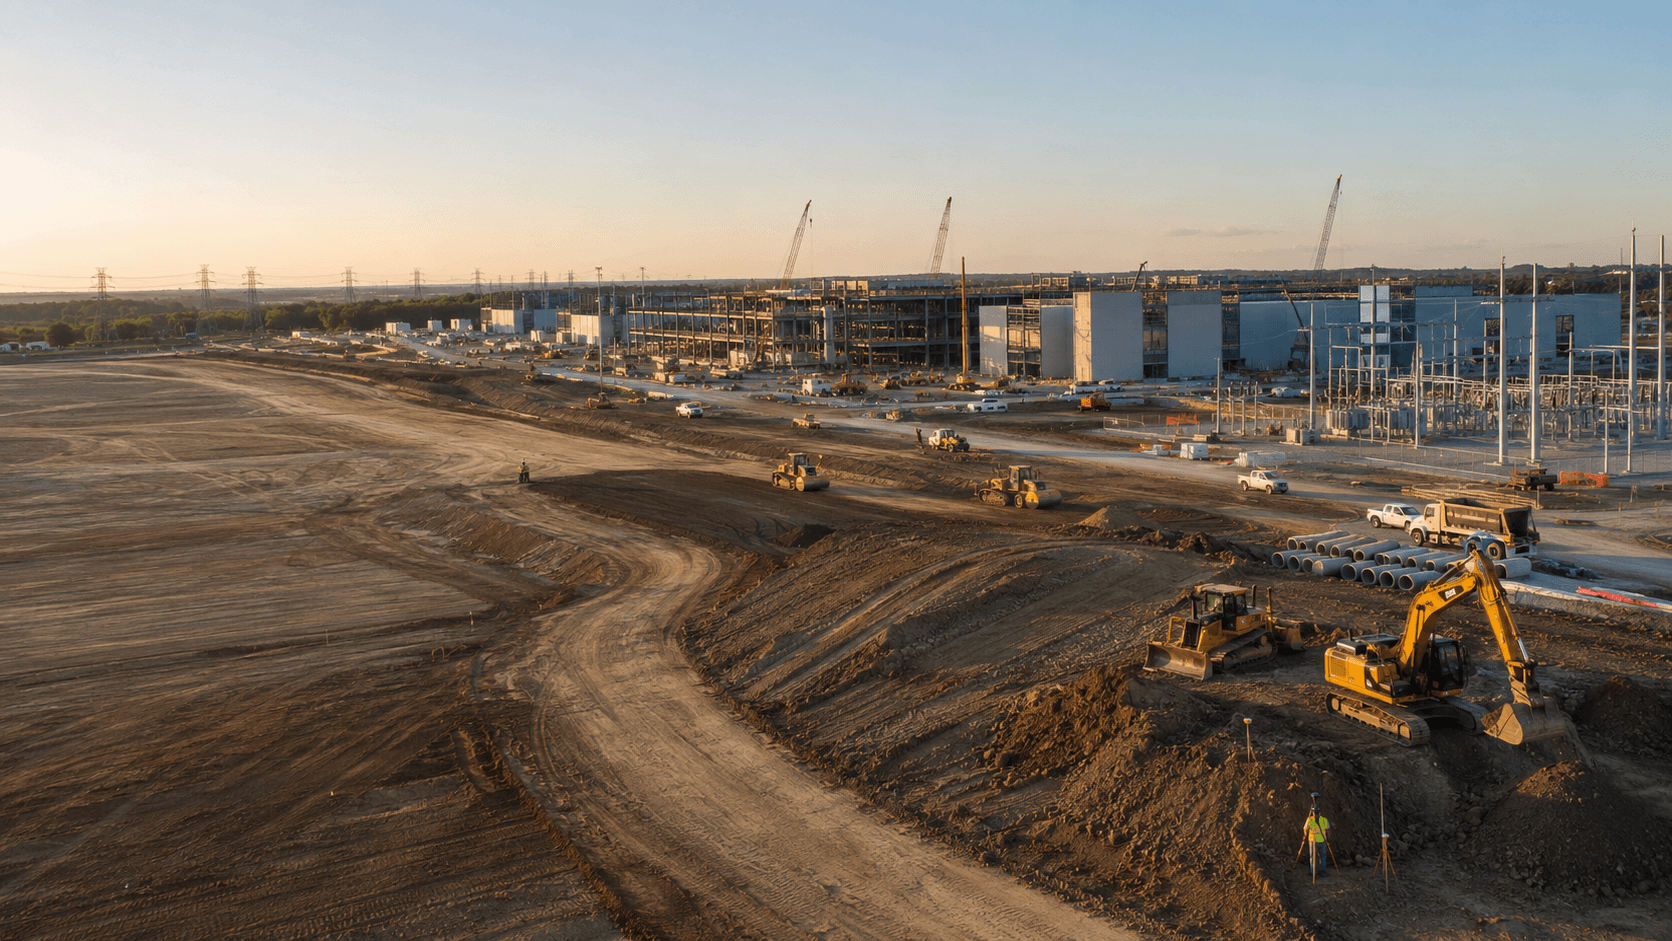
On a data center site, the earthwork moves fast and the quantities pile up. You know the cut and fill. You know what you moved this period. But the people who approve the math, the GC project manager, project controls, the owner’s rep, mostly don’t live in cut/fill and haul math all day. So when a quantity hits the pay app, the default response isn’t “looks right.” It’s “prove it.” And every “prove it” loop costs time, attention, and cashflow.
That’s the real shift to understand: on a fast-moving data center job, the pay app becomes a negotiation instead of a straightforward approval. The work is done. The money waits.
Why data center projects make this harder
Earthworks teams have always dealt with quantity scrutiny. Data center work adds three factors that amplify it.
Change velocity is the baseline. Pads, berms, stormwater, access, and laydown evolve continuously, with overlapping phasing and resequencing. The same dirt gets staged, moved, and moved again, so double-handling is normal. When the site keeps changing, “this month’s quantity” isn’t just a calculation. It’s an argument about what changed, when it changed, and whose scope it was.
The approvers aren’t earthworks specialists. GC PMs and owner’s reps need to validate quickly, but they aren’t in the weeds of surfaces, boundaries, and assumptions. If your evidence requires them to take your word for it, things slow down.
And without a shared baseline, every number is debatable. If you can’t anchor the claim to a known start state, you’re forced into back-and-forth: where were the boundaries, what changed, was that rework, was it double-handled.
What “defensible” actually looks like
Defensible doesn’t mean more precise. It means easier to validate.
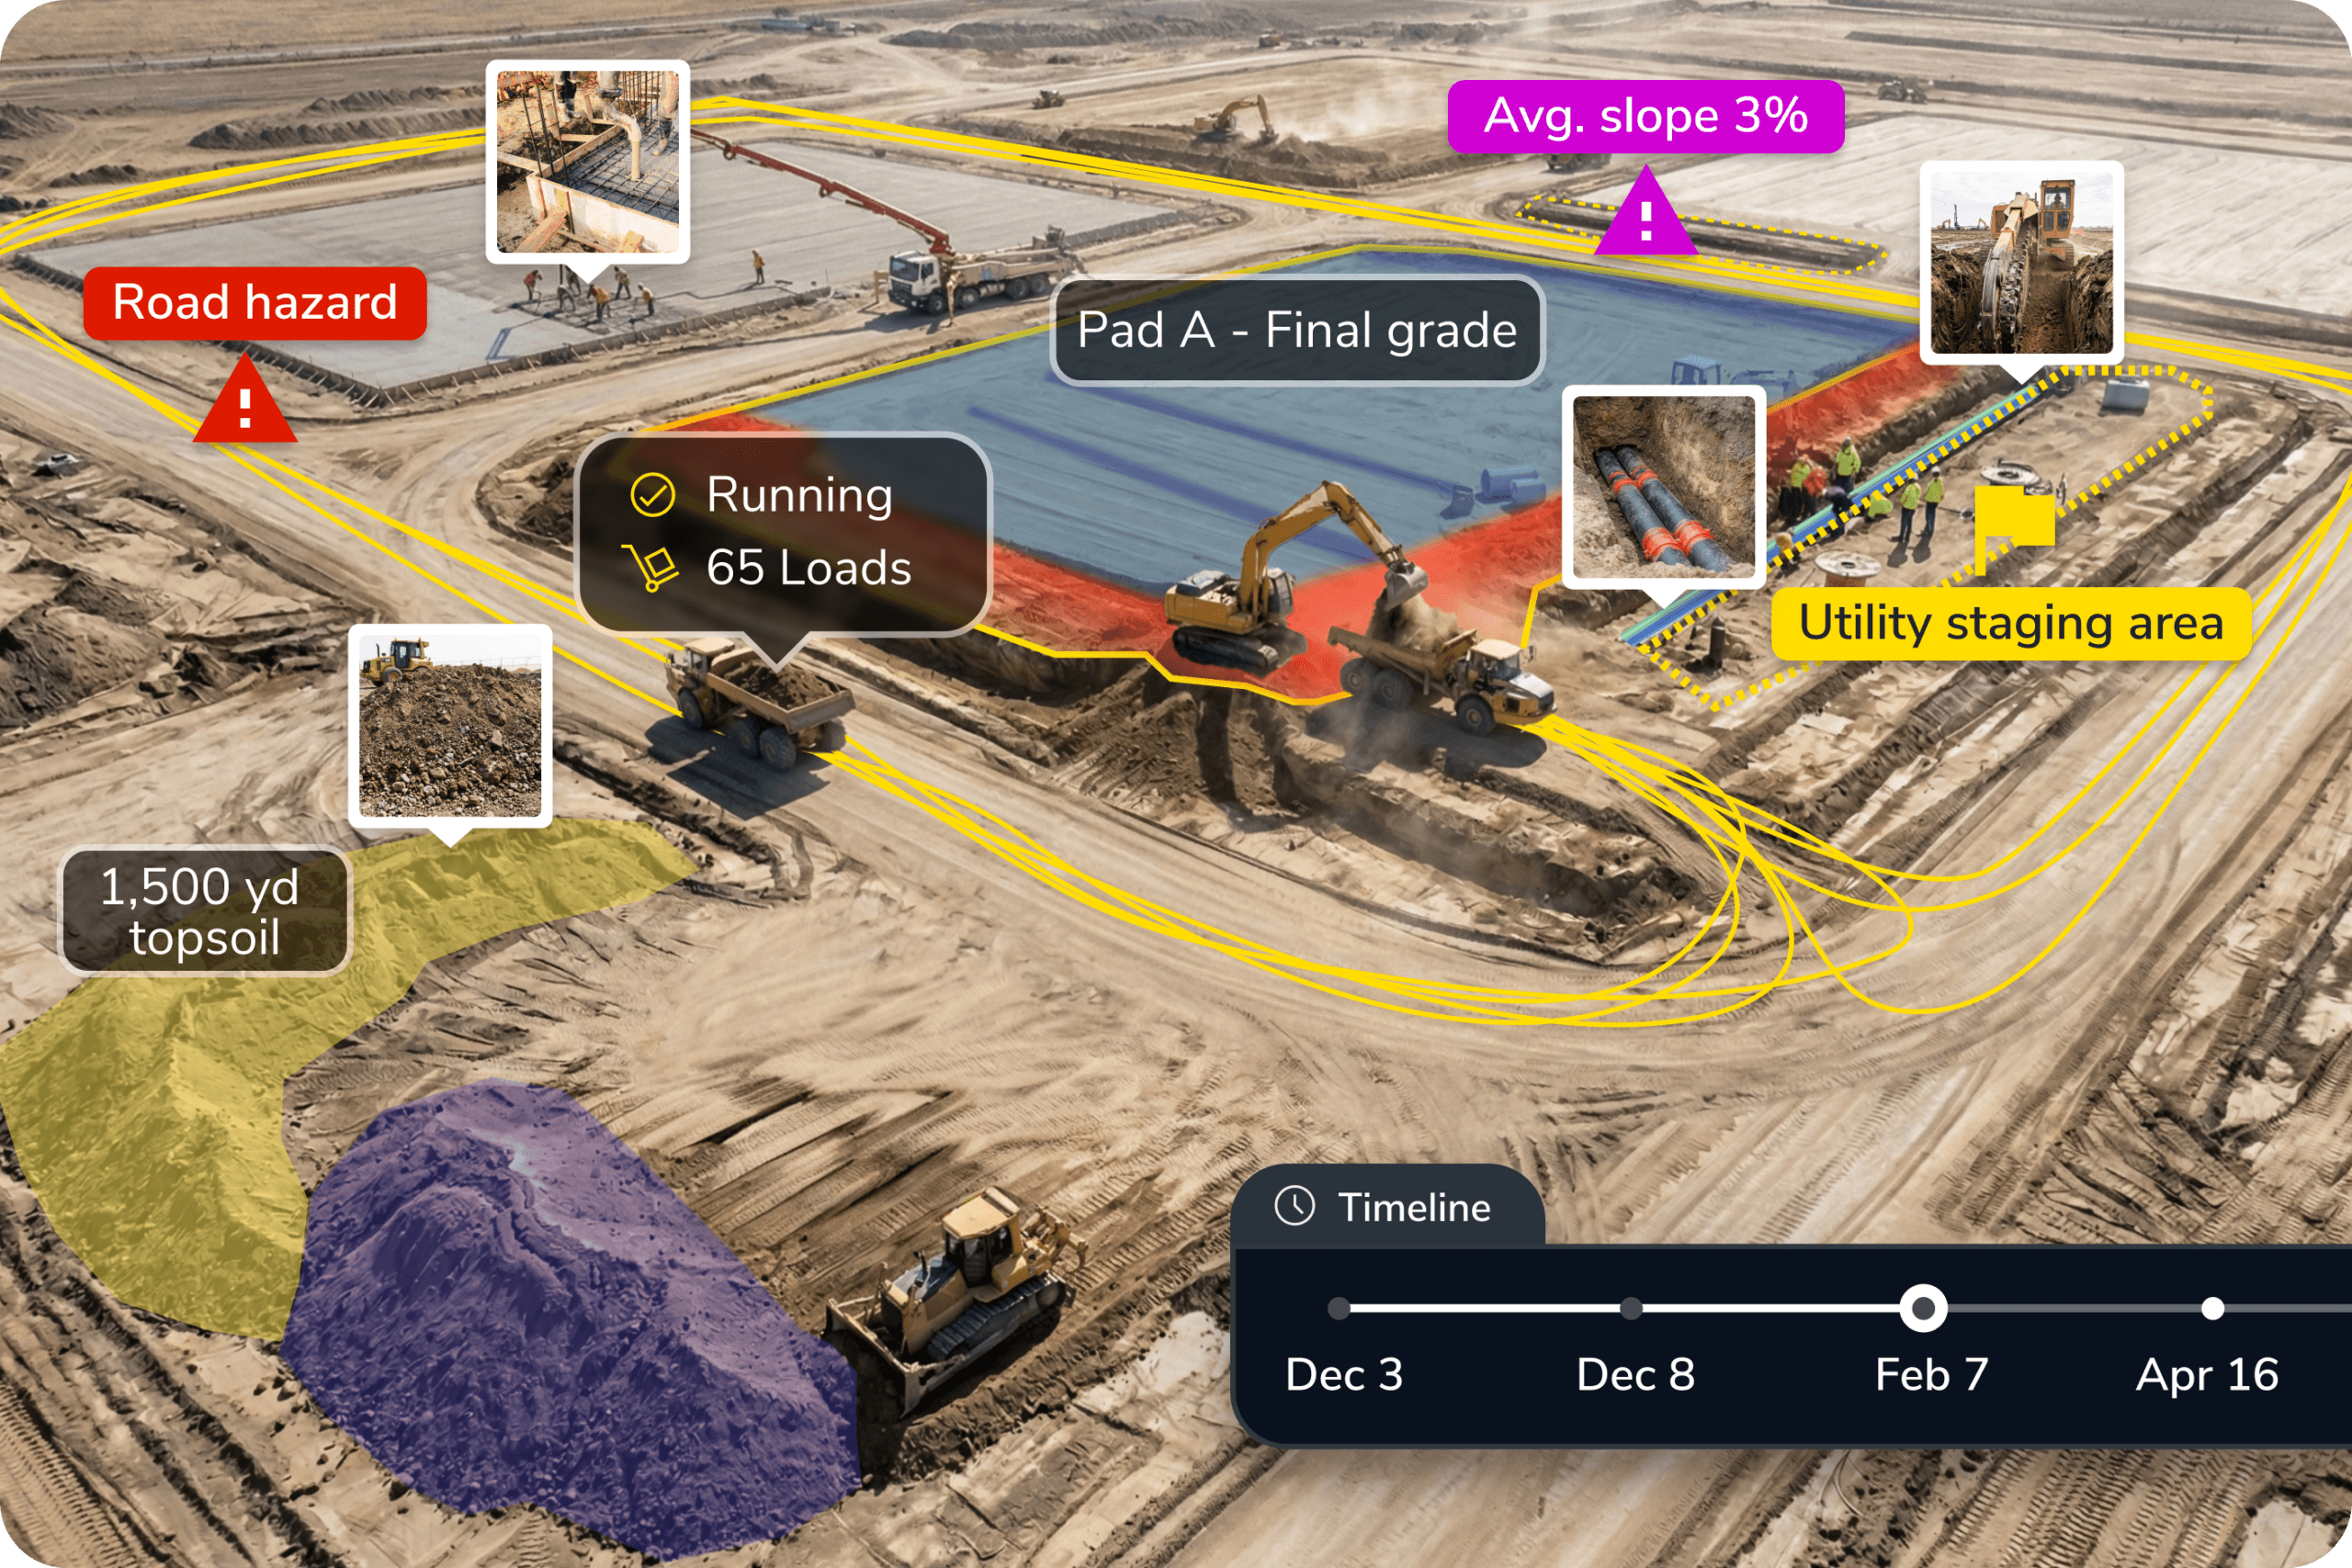
A defensible quantity answers three questions at a glance: how much, where, and over what time window. It’s time-stamped, tied to a specific window from date one to date two. It’s location-based, tied to a boundary on the site, not just a spreadsheet line item. And it’s visual, so a non-earthworks stakeholder can see what the number represents.
When you attach evidence like that, you’re not asking anyone to buy your assumptions. You’re giving them a simple way to read the proof for themselves. The conversation moves from “prove it” to “approved.”
A practical workflow in three steps
This is a workflow you can run repeatably on data center jobs, weekly, biweekly, or aligned to your pay-app cycle.
First, establish a baseline. Pick a start date everyone agrees on: the beginning of the pay period, a major phase change, or the day after a scope boundary was clarified. The outcome that matters isn’t just having a surface, it’s having a shared reference point. If a dispute comes up later, you can point to the baseline and say, “This is the start state for this window.”
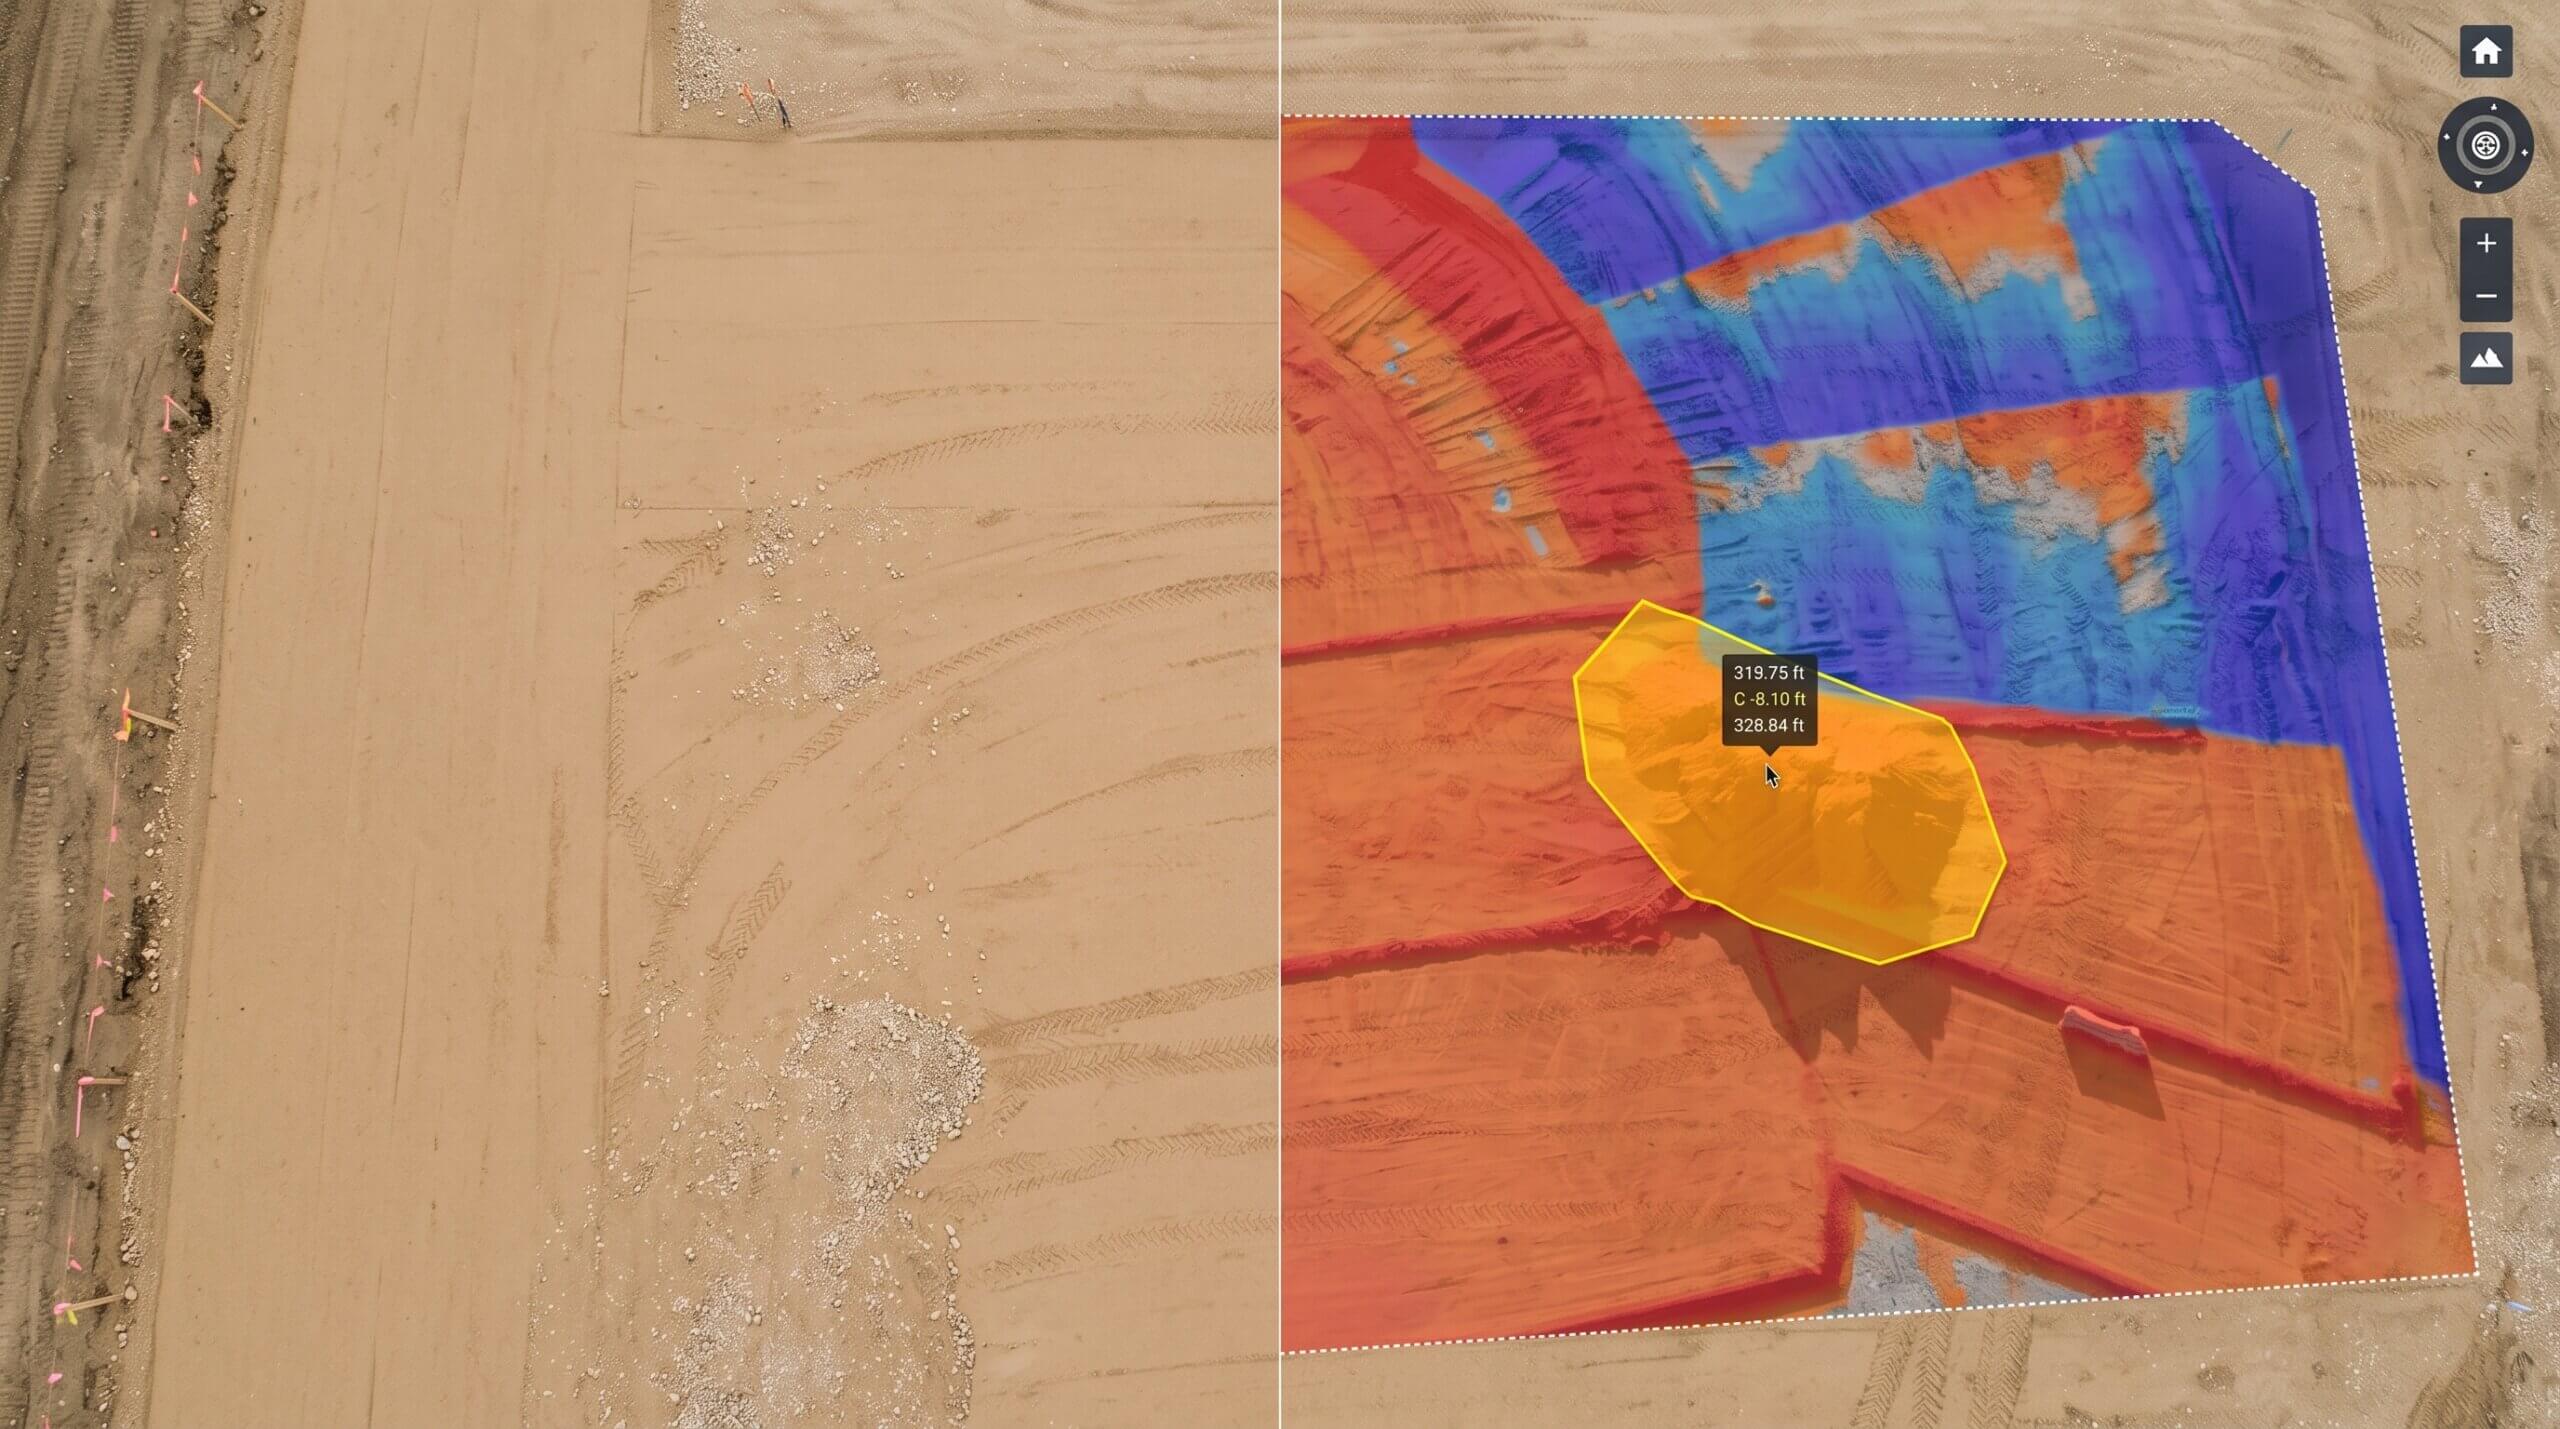
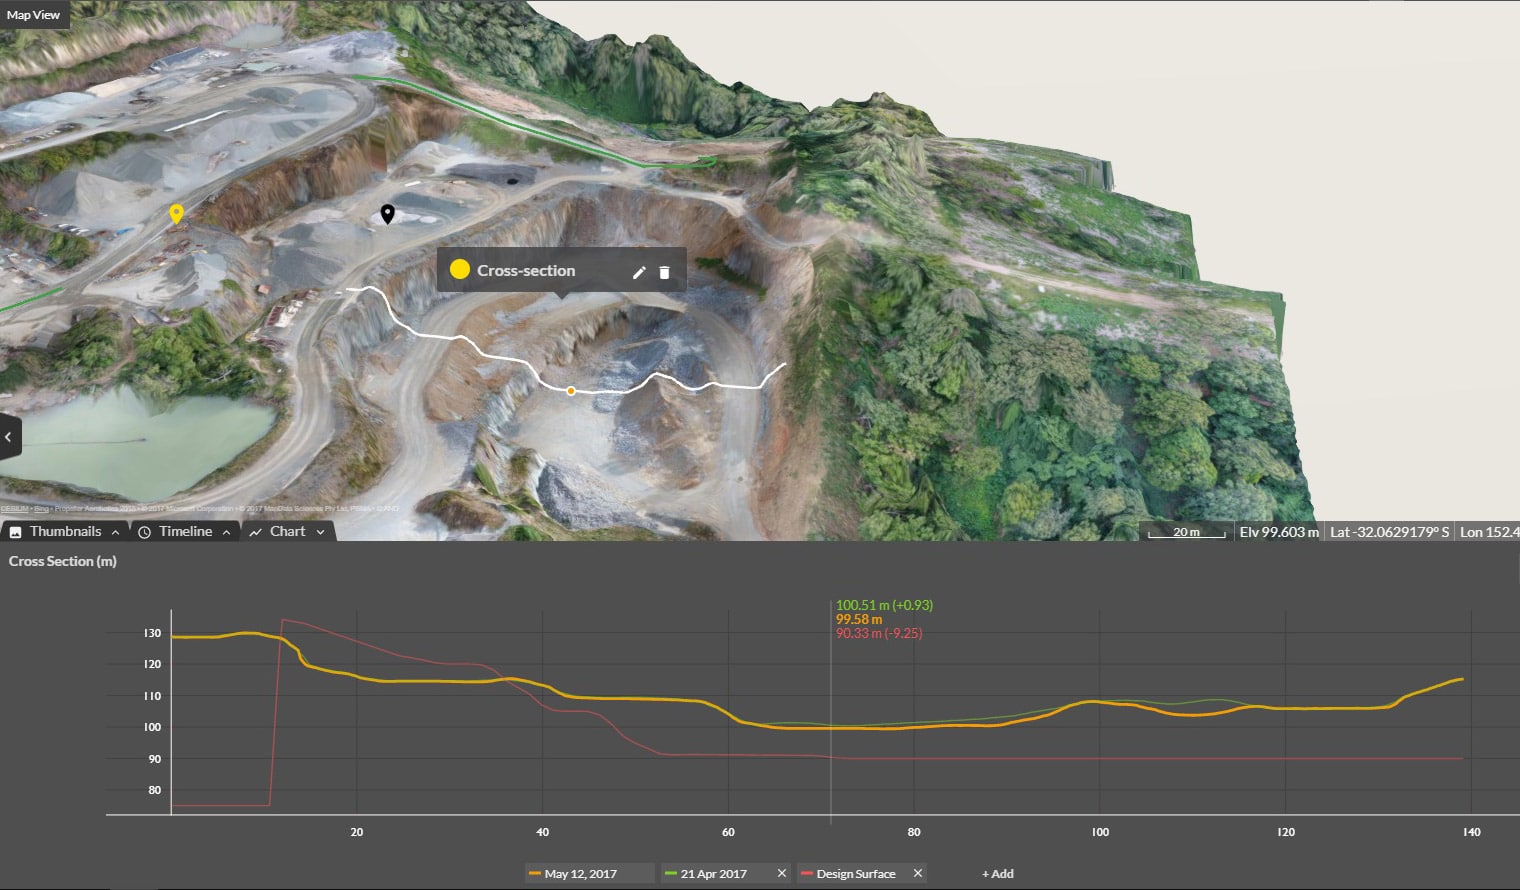
Second, measure the change window. At the end of the period, capture again and run a surface-to-surface comparison against the baseline. This is where teams accidentally create ambiguity, mixing methods or shifting boundaries between captures. The goal is repeatability: same approach, same boundaries, same cadence. When you can quantify change over a defined period, you’re no longer debating “how much” in the abstract, you’re showing what changed between two known states.
Third, package the evidence. Approvers don’t need your full methodology. They need enough clarity to say yes with confidence. A good proof package includes a map view that anchors the quantity to the exact area on site, a before and after visual, and a clear quantity output with units, boundary, and date range. Add a short note that answers the obvious questions: “excludes rework,” “includes double-handling,” “boundary matches pay item X.” If an owner’s rep can understand the claim in about a minute, approvals move faster.
With Propeller, this runs on repeatable volume and stockpile measurements, survey-to-survey comparisons that quantify change across a date range, and shareable measurement reports that let approvers validate on their own. When someone asks “when did that change happen?”, the historical record on the map answers it without rebuilding the story from memory.
Common failure modes, and how to fix them
Most pay-app disputes trace back to a few predictable traps.
The missing baseline is the big one. Without it, every question becomes subjective: was that already there last cycle, is that new work or rework, did the boundary change. Fix it by making the baseline non-negotiable. No baseline, no claim.
Unclear scope boundaries cause the next wave. Most quantity disputes are boundary disputes in disguise. When the measured area doesn’t match the pay-item area, approvers can’t reconcile your number with their scope. Fix it by tying the measurement boundary to the pay item before you capture, and document when and why a boundary shifts.
Inconsistent cadence is the quiet killer. When measurements happen whenever there’s time, you get gaps, and gaps are exactly where disputes live. Fix it by picking a cadence that matches the project tempo, often weekly on data center work, and sticking to it. On data center pace, frequent, repeatable tracking is what makes change orders and pay apps survivable.
Move from “prove it” to “approved”
The teams that get paid faster aren’t doing harder math. They’re making their quantities easy to validate, with dated, location-based, visual proof that any stakeholder can read in a minute.
Book a 30-minute data center demo and we’ll walk through baseline, compare, and proof package on a real data center scenario, or explore how Propeller measures volumes on active sites.