Construction projects generate more data than ever, but data alone does not move a job forward. The teams turning that raw information into decisions are construction data analysts, VDC and BIM managers, and project controls professionals. Their challenge is rarely a shortage of data. It is getting fast, accurate, consistent site data they can actually trust.
Drone mapping has become one of the most reliable ways to feed those workflows. It gives analytics teams repeatable, high-precision site data that supports reporting, progress tracking, and the operational decisions that keep a project on schedule and on budget.
This article covers what construction data analytics is, the common types of construction data captured on site, how drone mapping outputs support analysis, and the benefits of a data-driven approach to earthwork and grading.
What is construction data analytics?
Construction data analytics is the practice of capturing, analyzing, and interpreting site data to improve planning, tracking, and decision-making across a project. It turns measurements, imagery, and production records into something a team can act on: a clear answer to whether the project is on schedule, on budget, and built to design.
Data visibility matters because construction decisions are time-sensitive. When a project manager has to wait days for a survey crew to confirm elevation, the schedule waits with them. Analytics shortens that gap by putting current, accurate information in front of the people making the call.
The industry is steadily moving from manual reporting to digital workflows. Spreadsheets and paper notes are giving way to shared maps and automated reports, which means fewer transcription errors, less duplicated effort, and a single version of the truth across the field and the office. Done well, analytics supports scheduling, budgeting, and risk reduction at the same time, because every one of those depends on knowing where the project actually stands.
What is an example of construction data?
Modern construction projects generate large amounts of operational and spatial data every day. A few of the most common examples:
- Earthwork quantities: cut and fill volumes that tell teams how much dirt has moved and how much is left
- Site progress measurements: surface and feature changes captured over time to confirm work against the schedule
- Elevation and terrain data: the shape of the ground, used to compare current conditions to design
- Stockpile volumes: material inventory measured for reconciliation, billing, and planning
- Equipment data: machine run and idle time, load counts, and cycle data that show how a site is performing
- Safety and access information: hazards and site conditions documented for the whole team to see
- Surface comparisons against design: the gap between as-built and the model, which drives rework decisions
Each dataset earns its place by answering an operational question. Earthwork quantities support billing and forecasting. Progress measurements confirm the schedule. Surface comparisons catch deviations before they become expensive rework.
Types of construction data used in project decision-making
Construction teams rely on several types of operational and site data to monitor progress, track production, and support planning decisions. It helps to group them by what they tell you.
Visual progress data
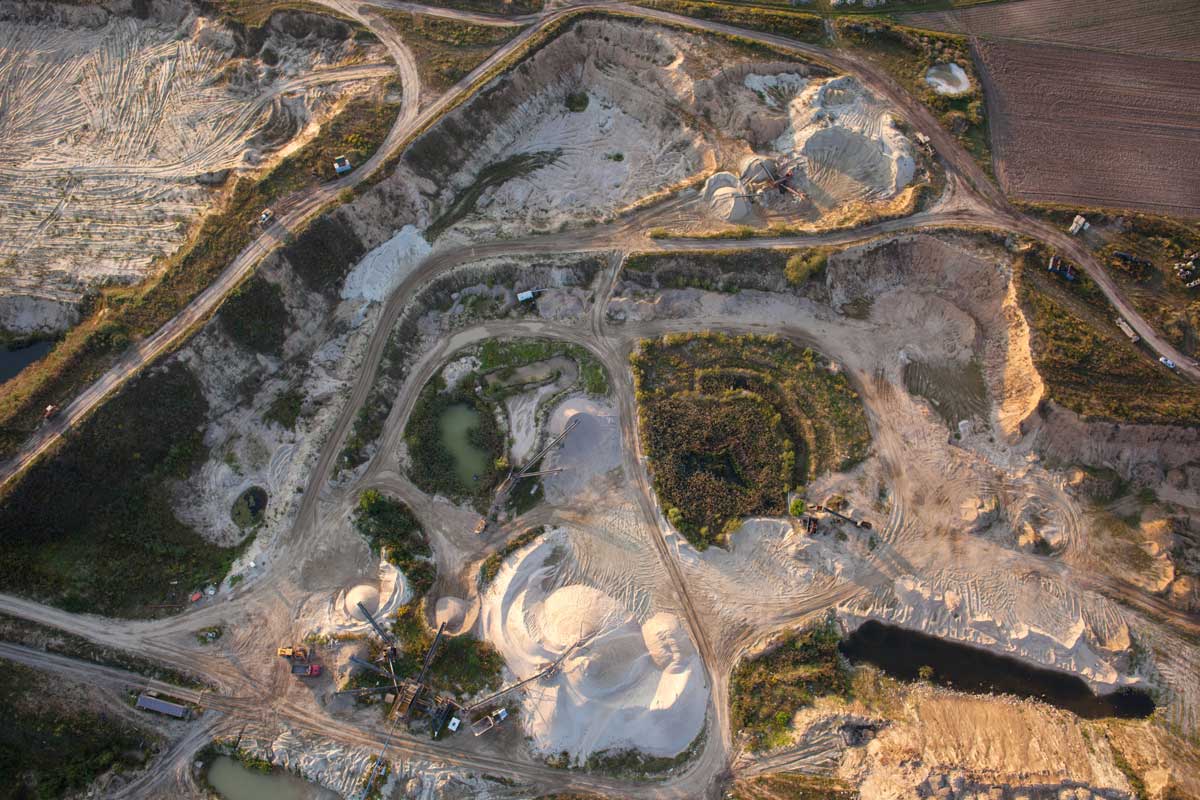
Teams use visual site data to monitor progress, document conditions, and improve communication between the field and the office. Common examples include aerial imagery, orthophotos, progress photos, and timeline comparisons captured through drone mapping. A side-by-side view of a site across two captures often communicates more in a glance than a page of notes.
Operational and production data
Operational data includes truck counts, machine activity, haul cycle times, production rates, and material movement. This information helps teams understand how a site is performing, spot inefficiencies early, and improve forecasting across the project lifecycle. It also helps eliminate construction data overload by tying production numbers back to one shared view of the site.
Earthwork and quantity data
Earthwork data includes cut and fill calculations, stockpile volumes, surface comparisons, and grading progress. Teams use this information to verify quantities, track production against design, and support reporting and billing. Because it is measured rather than estimated, it gives everyone from the estimator to the owner a defensible number to work from.
How drone mapping supports construction data analytics
Drone mapping gives construction teams fast, repeatable, and high-precision site data. That combination is what makes it so useful to analytics workflows.
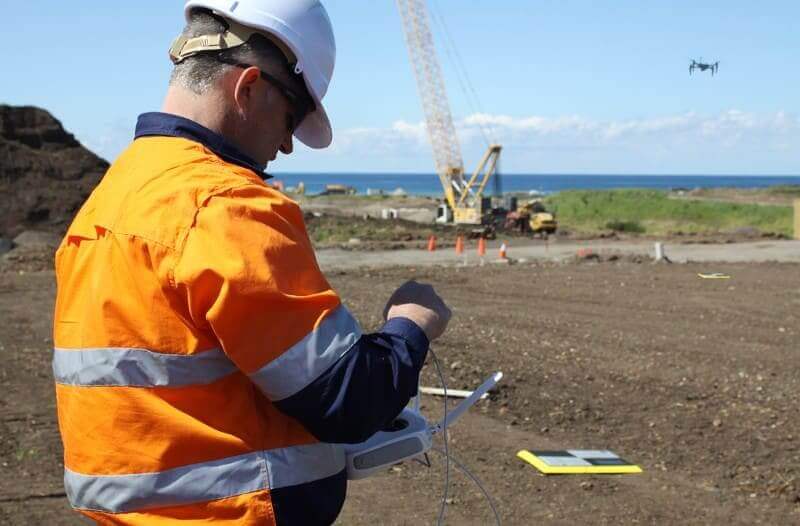
- Faster capture across large sites: a drone covers acreage in minutes that would take a ground crew days
- Centralized project visibility: every survey lives in one place the whole team can reach
- Repeatable surveys over time: consistent capture means clean comparisons from one week to the next
- Improved reporting accuracy: measured data reduces the guesswork in progress and quantity reports
- Fewer manual site measurements: less time spent walking the site with a rod and tape
- Better field-to-office communication: when everyone works from the same map, updates do not get lost in translation
For teams weighing how this fits alongside other methods, it helps to understand the difference between reality capture data and the focused, measurable surveys that drive analytics.
How construction data analysts use drone mapping outputs
Once the data is captured and processed, analysts put the outputs to work in a few consistent ways:
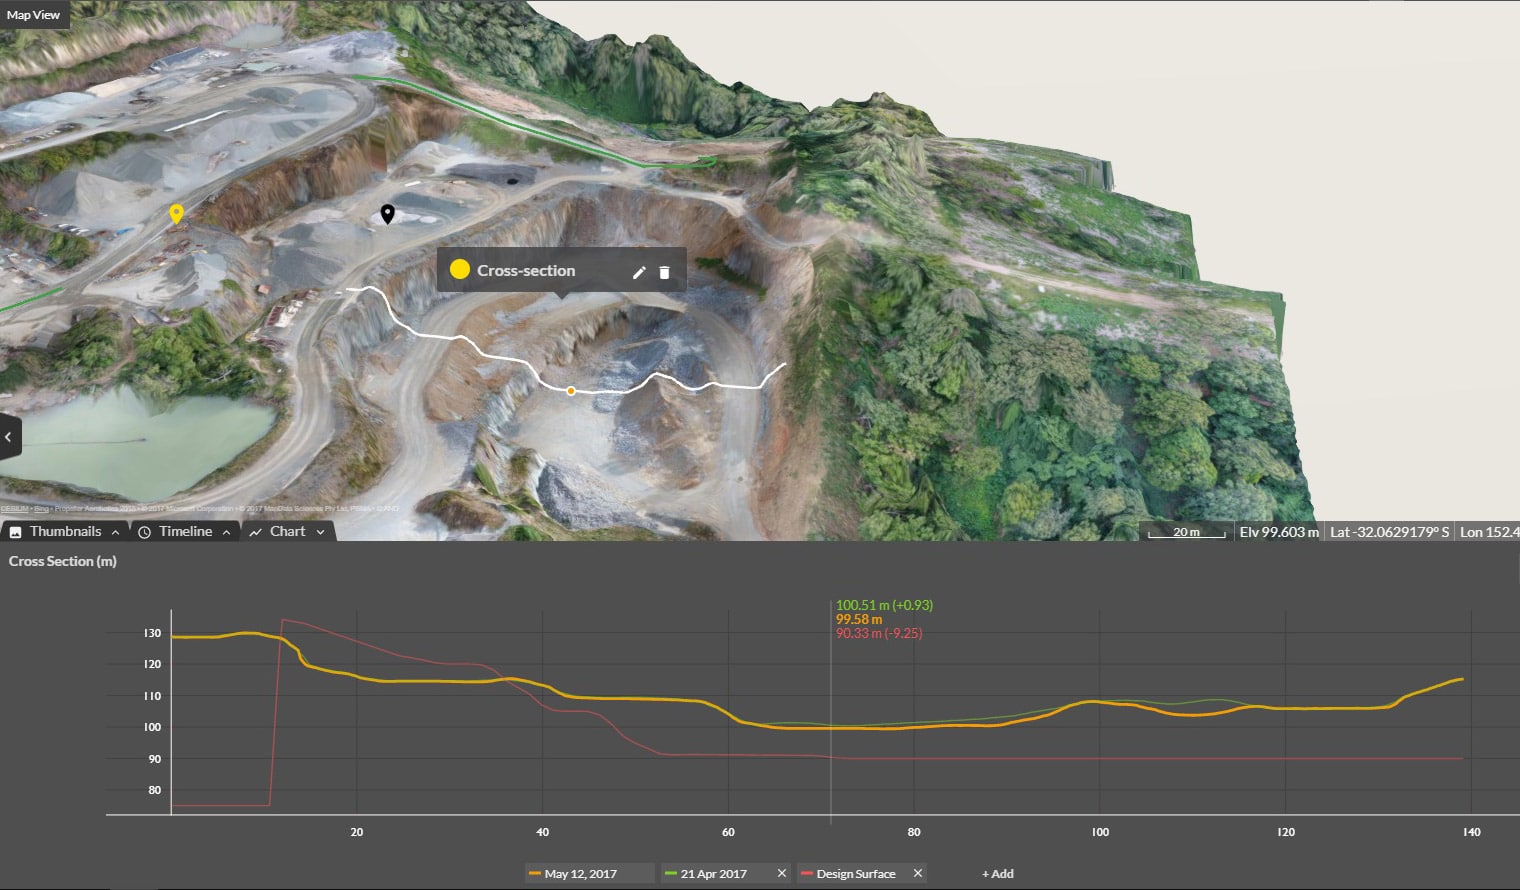
- Comparing actual site conditions against design to confirm work is built to the model
- Monitoring grading and earthwork progress between captures
- Tracking material movement and production over time
- Supporting project forecasting with measured, current numbers
- Identifying delays or deviations early, while there is still time to act
- Creating visual reports that give stakeholders a clear picture without a site visit
The value is in the analysis, not just the imagery. A deeper look at the drone survey outputs available shows how much of this work flows from a single capture.
Benefits of drone mapping for construction teams
Improved decision-making
Better visibility into site conditions and progress means decisions get made on current data, not last week’s assumptions. Analysts can answer questions in minutes that used to require a field trip or a wait for the survey crew.
Increased efficiency
Drone workflows reduce manual reporting and speed up site analysis. Automated reports and shared maps cut the hours spent compiling updates, which frees lean teams to focus on the work that needs judgment.
Better data accuracy
High-precision measurements improve confidence in reporting and forecasting. When the numbers behind a progress report or a billing claim are measured rather than estimated, they hold up to scrutiny, which protects margins and reduces disputes. This is especially valuable for teams managing construction site planning across multiple active sites.
Common challenges with construction data management
Even teams with plenty of data run into the same recurring problems:
- Disconnected systems: data scattered across platforms that do not talk to each other
- Delayed reporting: information that arrives too late to change the outcome
- Inconsistent field data: measurements captured differently from crew to crew
- Manual workflows: hours lost to transcription and rekeying
- Limited site visibility: gaps between what the field sees and what the office knows
Centralized drone mapping helps reduce these issues by giving every team one shared, current map. When the survey, the report, and the design all live in the same place, the disconnects start to disappear.
Frequently asked questions
Construction data analytics is the practice of capturing, analyzing, and interpreting site data to improve planning, tracking, and decision-making across a project. It turns raw measurements and imagery into clear answers about progress, quantities, and site performance.
Common examples include earthwork quantities, site progress measurements, elevation and terrain data, stockpile volumes, equipment data, and surface comparisons against design. Each one supports a specific operational decision, from billing to scheduling.
Drone mapping captures fast, repeatable, high-precision site data across large areas. Teams use it to track progress, measure earthwork volumes, compare conditions to design, and keep the field and office working from the same information.
A single drone survey can produce orthophotos, 3D terrain models, elevation data, volume measurements, and surface comparisons, all viewable in one place and ready for reporting and analysis.
It gives them accurate, current, repeatable data without the delays of manual measurement. That means faster analysis, more reliable forecasts, and reports that hold up when it matters.
Turning construction data into better decisions
Drone mapping helps construction project teams improve visibility, reporting, and efficiency through accurate, repeatable site data. The teams that get the most from it are the ones who treat data as a decision-making tool, not a filing requirement. Better data leads to better decisions, and better decisions keep projects on schedule, on budget, and built to design.
Want to see it on your own sites? Request a demo to see construction data analytics in action.