Beyond reporting on stockpiles: What else you can measure with drones and Propeller’s volumetric tools?

Read Time: 7 mins
Quick links

    Propeller’s three volume measurement modes (Smart Volume, Volume Compare, and Reference Level Volume) give earthwork teams a single tool set for measuring stockpiles, ramp designs, pit volumes, landfill airspace, blast estimates, coastline erosion, and design-to-terrain comparisons, all from drone survey data processed into a shared 3D map. Teams can capture, visualize, and export volume measurements without additional software or surveyors walking the site.

    Many worksites around the globe have started to adopt drones to improve operator efficiency and safety.

    The most common use case is regularly capturing accurate volumetric measurements of stockpiles, but only a small portion of these businesses have harnessed the full potential of their existing data and tools.

    It’s quick and easy to get your end-of-month stocks captured using drones and Propeller, but that’s just the beginning. Did you know you can measure and visualize changes in your tailings dam, measure erosion, compare against your design, and calculate density, all using Propeller’s volumetric tools?

    All of these workflows and more are possible using just one set of tools. Let’s walk through the use cases and show you what’s possible.

    Different types of volumetric tools on Propeller

    When you’re using the Polygon tool (Polygon tool icon), you can set the volume(s) to one of three different modes:

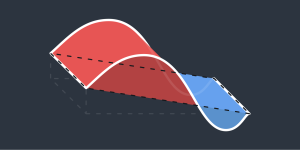
    Smart Volume: The default volume measurement mode. Generally used for stockpiles and ramps.Smart volume icon
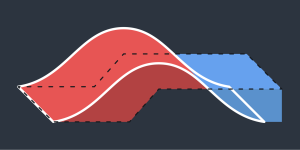
    Volume Compare: Used to track changes between flights, or compare your current terrain against the design.

    Volume compare icon

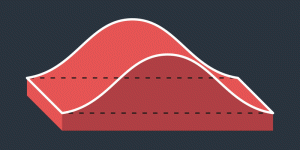
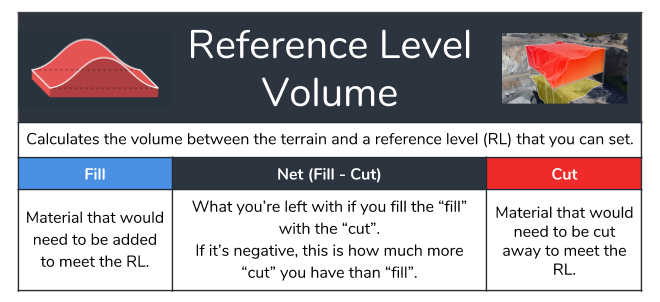
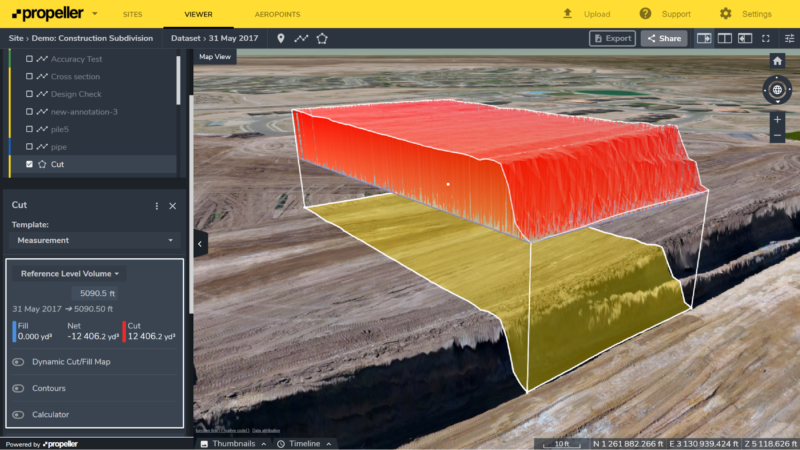
    Reference Level Volume: Used to compare the terrain against a reference level.Reference level volume icon

    Once you’ve done any of the calculations above, they’re more than just numbers on a page. On the Propeller Platform, all volume measurements are instantly visualized in 3D, so anyone can understand what’s been measured and visually track volume changes.

    Use cases: Smart Volume

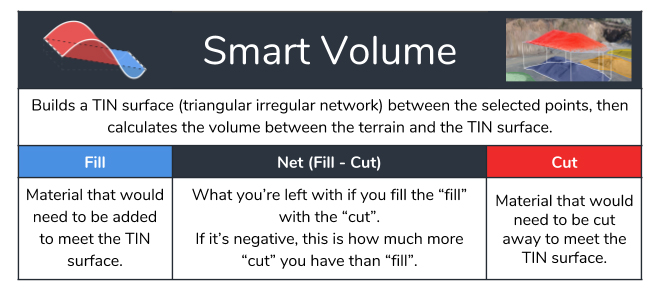
    Smart volume tool summary

    Measuring stockpile volumes from drone data

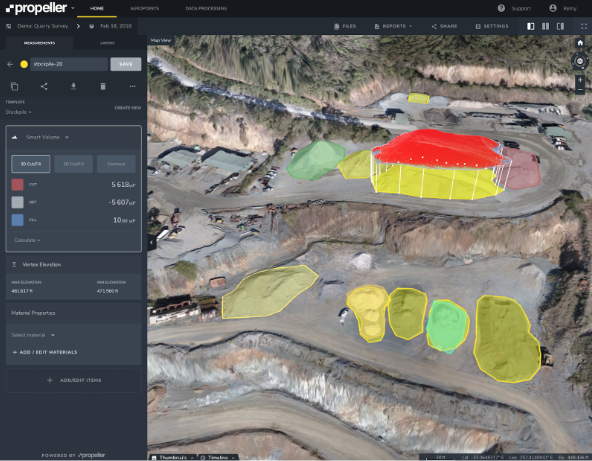
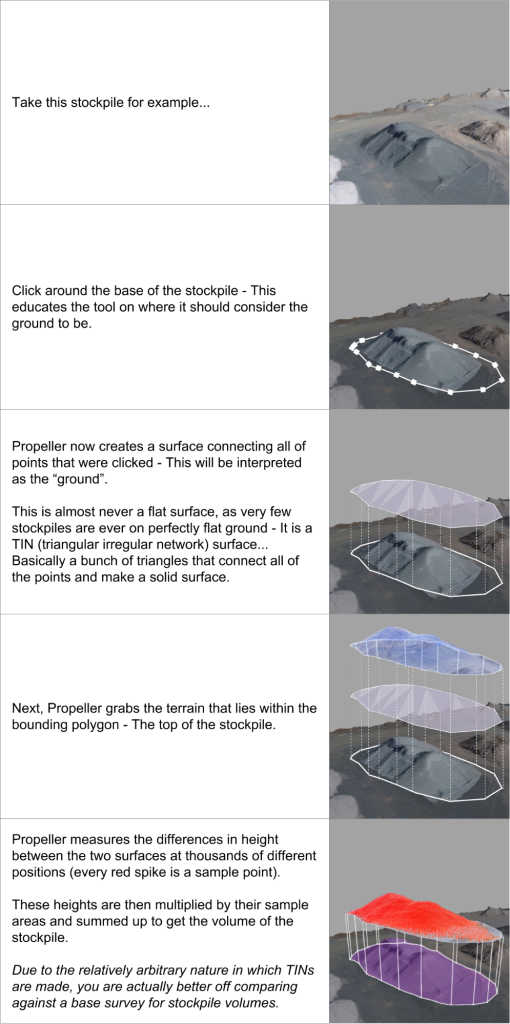
    Click around the base of any stockpile and Propeller will tell you the volume of it.

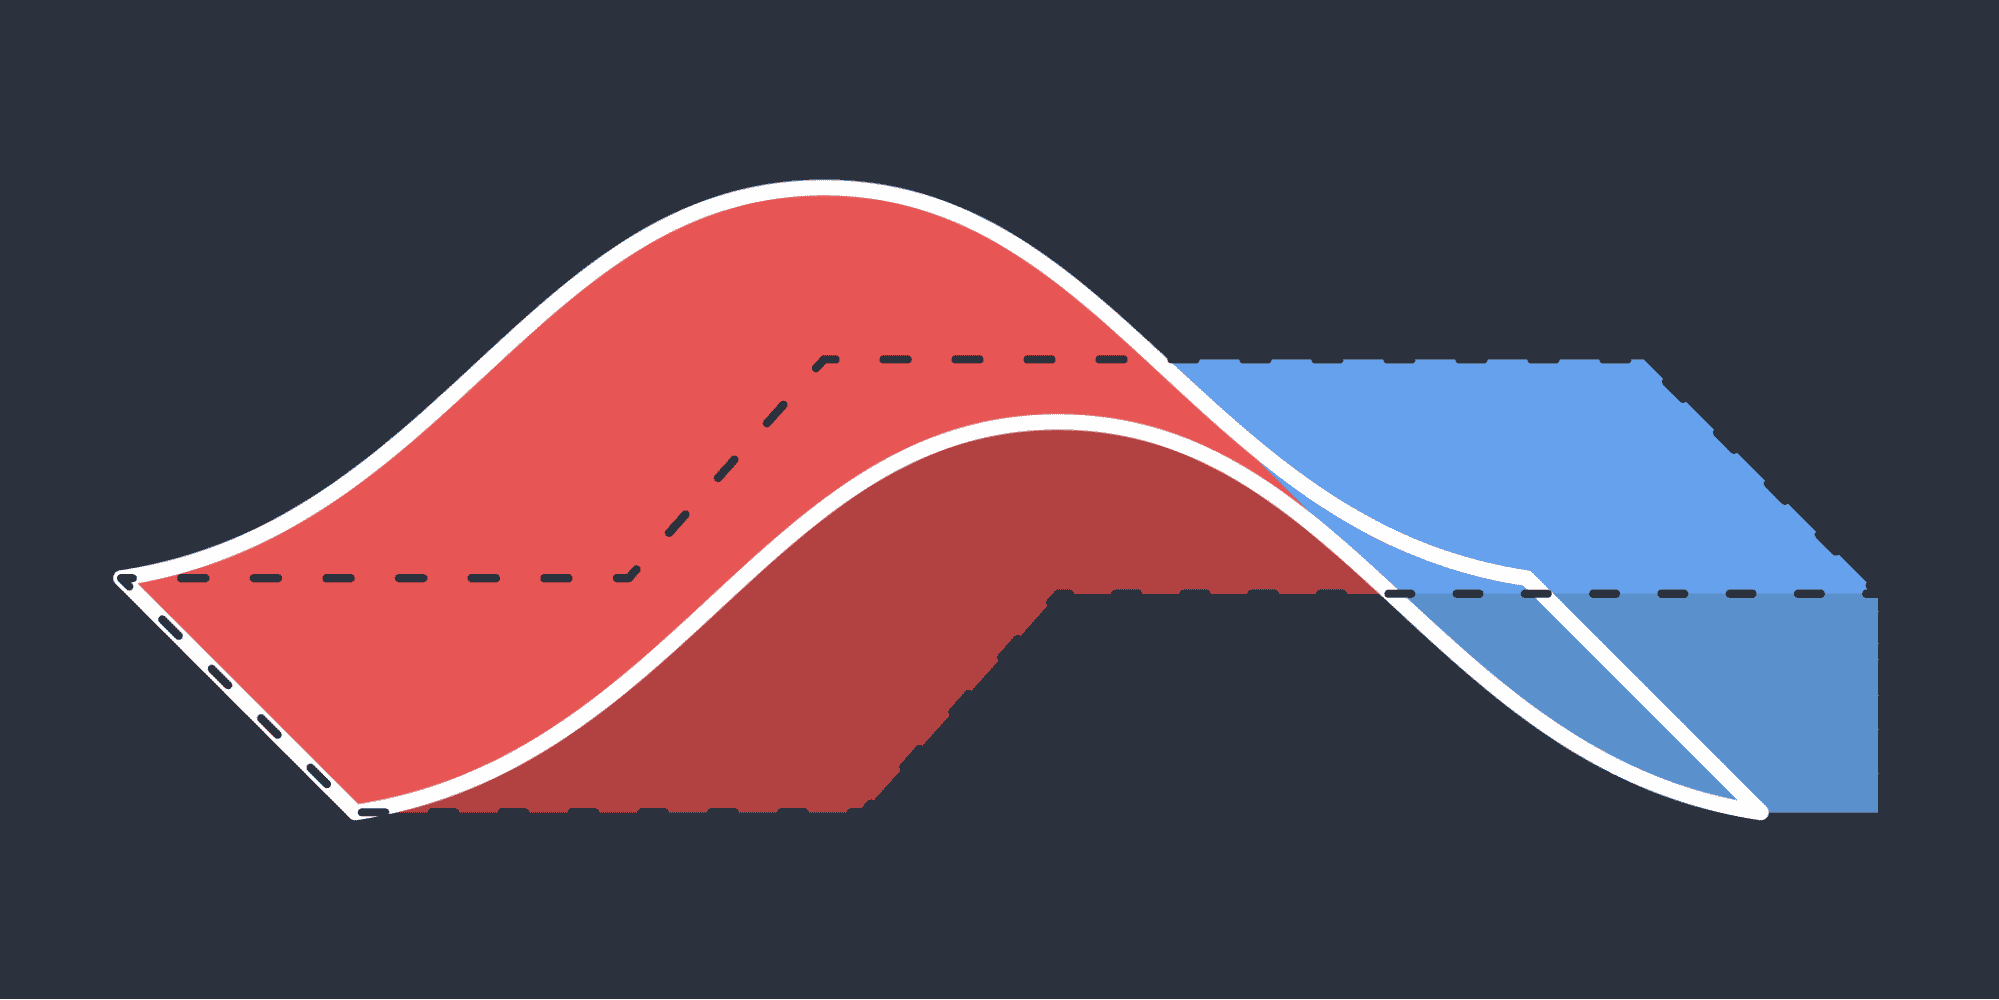
    Note that very few stockpiles get the privilege of sitting on perfectly flat earth. When you click around the toe of the pile, you are telling the tool what to consider “ground,” and Smart Volume takes this into consideration when performing its calculations.

    Volume calculations for ramp designs

    Say you want to build a 40ft wide, one in 10 ramp out of a trench and you want to know roughly how much material you’re going to need.

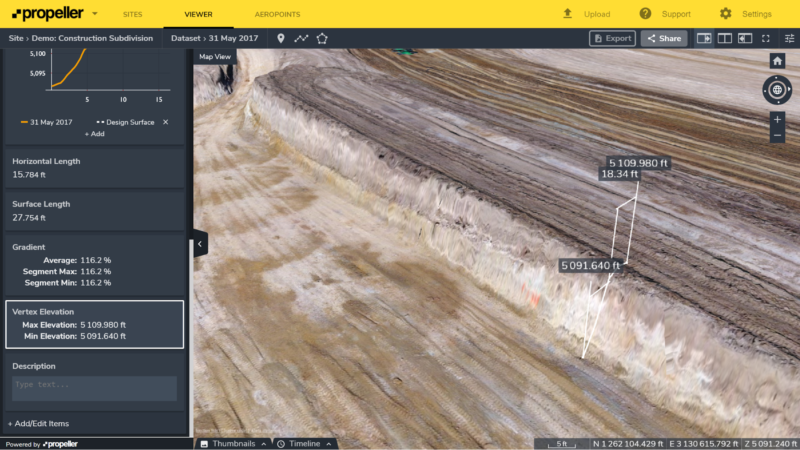
    First, calculate the height with the Line tool set to Vertex Elevation.

    Elevation measurement using drone data

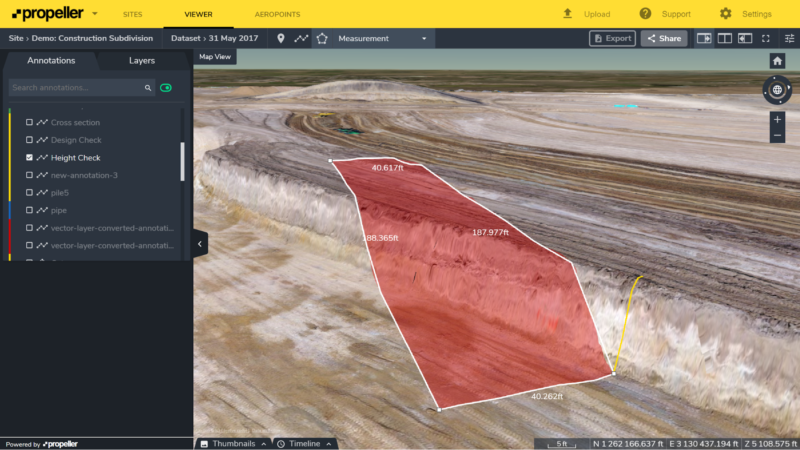
    Now that we know the difference in height is around 18ft, select the Polygon tool and draw out the ramp from that point, using the live readout of the lengths to guide you.

    Ramp volume measurement

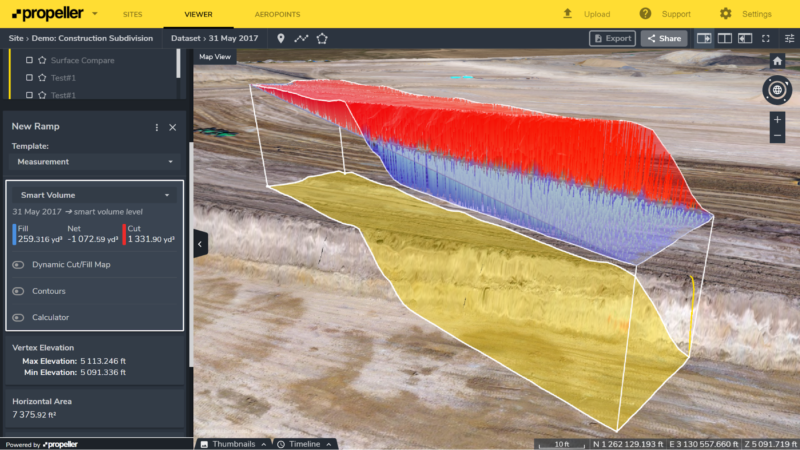
    The volumes are visualized and calculated automatically. You can see where you’ll need to fill (blue) and cut (red) to build the ramp, with those values calculated in the left panel.

    Ramp volumetric calculation using drone data

    Once the ramp is built, you’ll have more than 1,000yd3 of leftover material to use elsewhere or move off site (Net). Free fill anyone?

    But how does Propeller actually calculate Smart Volume?

    Smart volume how it works on the Propeller Platform

    Use cases: Volume Compare
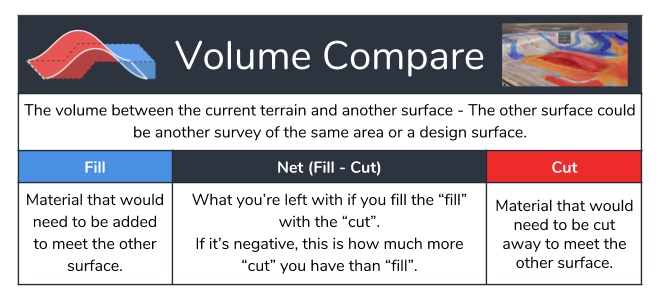
    Volume compare tool intro

    Performing complex volume comparisons against other surveys and design files is fast and straightforward with Propeller.

    We’ve only scratched the surface on applications for this tool, so if you come up with something new, let us know!

    Here are some of the use cases we’ve come across so far.

    Volume calculations for progress claims

    Know exactly how much dirt you and your contractors have moved and reconcile quantities accordingly. No more miscounting or underfilling trucks.

    In the image below, we’re doing a volume comparison against a previous survey of the same job, with the Dynamic Cut/Fill Map switched on.

    The red sections show where contractors have cut away 20,000yd3 of material; the blue shows where they’ve filled in 11,000yd3. We’ve also entered a density figure to calculate the tonnage.

    Propeller gives you a clear picture of where dirt is coming from and going to, summed up in the left panel and ready to export for reporting (complete with gridded cut/fill maps).
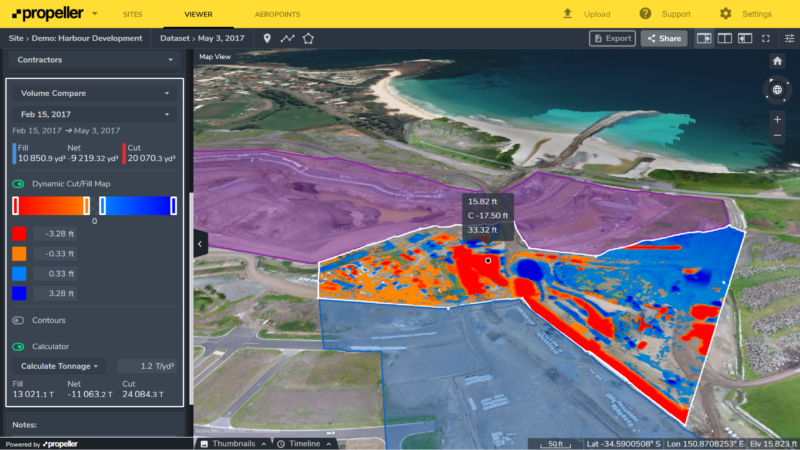
    Cut/fill map from drone data

    Learn more about using Propeller as your earthwork software.

    Measuring stockpile volume against the base

    The most accurate way to measure a stockpile is a volume comparison between the current stockpile and a survey of the base. The example below shows a portion of a stockpile filled between aerial surveys. This is a high-precision measurement of how much material is in the selected section.
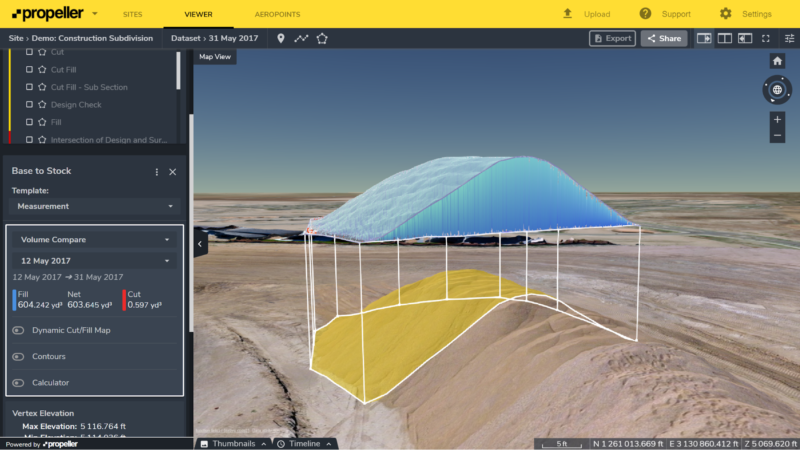
    Stockpile volume measurement

    Quickly tracking change in stocks

    If you have highly active stockpiles being filled and cut simultaneously, you can visualize and measure that change with Propeller.

    Here we have a stockpile that was being dumped on and dug off between two surveys. Propeller shows exactly where each was occurring and how much at a glance.
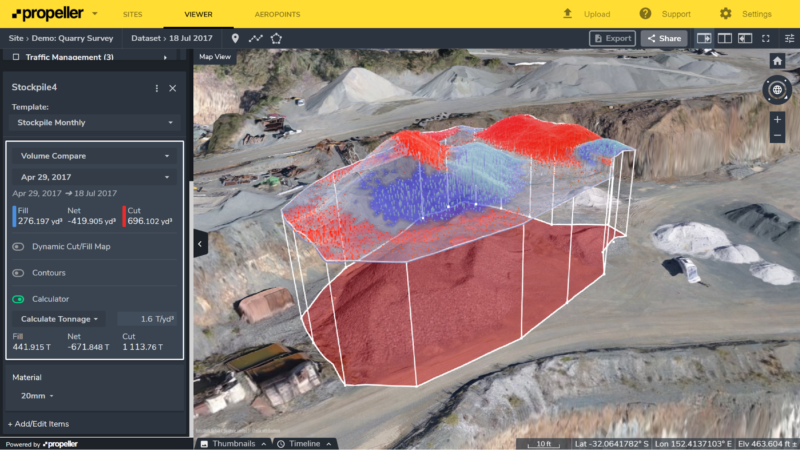
    Stocks tracking using drone volumetric

    Calculating the total volume of material removed from a pit

    Surveying an entire pit used to take so long that the pit would have changed before you finished. With drones and Propeller, it’s as straightforward as measuring a stockpile.

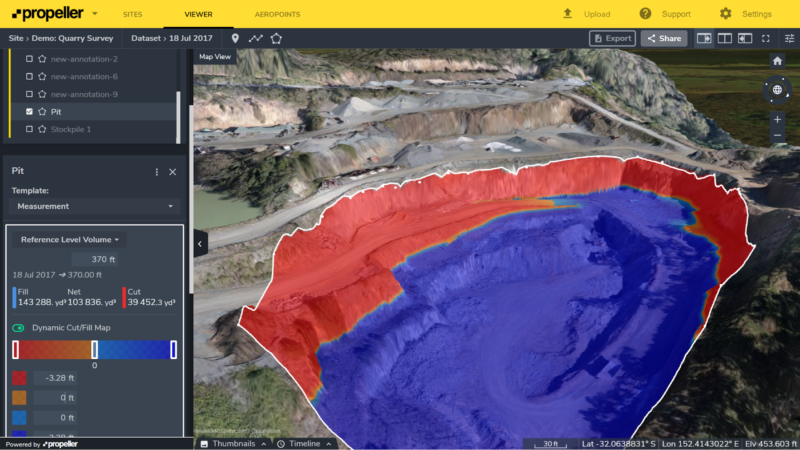
    Below we’ve traced around the perimeter of a pit and switched on the Dynamic Cut/Fill Map to see where material has been moving. Overall, around 14,500yd3 has been removed. Hover over any point within the pit and Propeller shows you the change in height at that exact location.
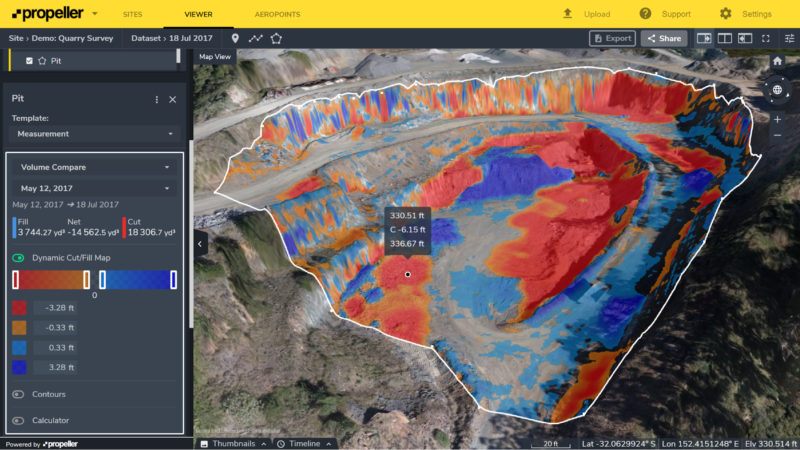
    Pit volume

    Measuring coastline erosion over time

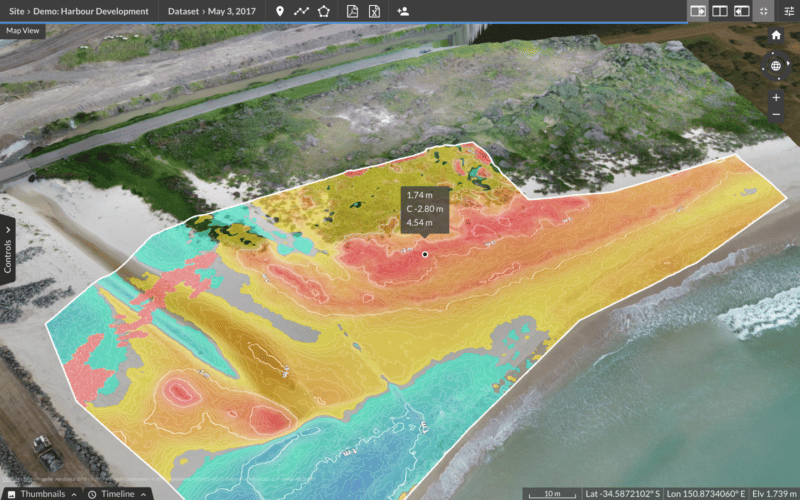
    Erosion is difficult and expensive to measure over time. Paying surveyors to walk lines along a beach every few months is a poor use of resources when you can get higher-resolution, 3D data more regularly with drones and Propeller.

    Here we have a beach within the bounds of a harbor development that has been surveyed multiple times.
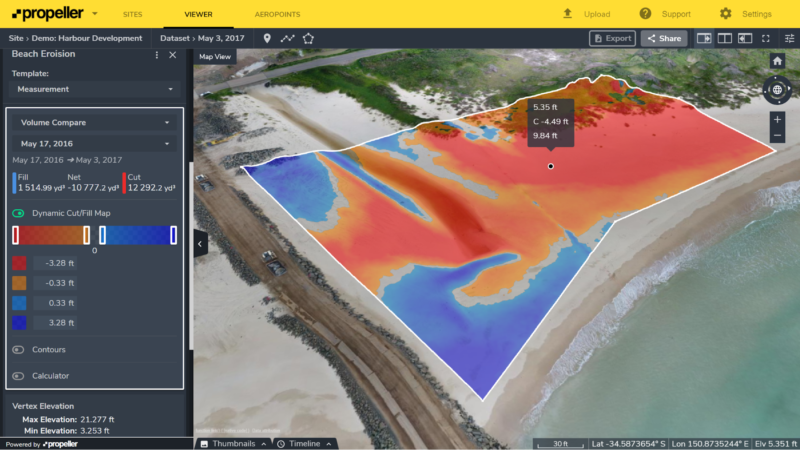
    Measuring coastline erosion with drone data

    By switching on the Dynamic Cut/Fill Map, you get a clear picture of where erosion is occurring (red) and where sand has been filled back into the beach (blue). Pair this with the cross-section tool and you have an in-depth view of what’s happening with the coastline.

    Learn more about measuring erosion with Propeller.

    Checking landfill compaction rate and available airspace

    Maximizing airspace is what drives landfill performance. Calculate compaction rates and remaining airspace as often as you need with Propeller, without walking over a single piece of waste.
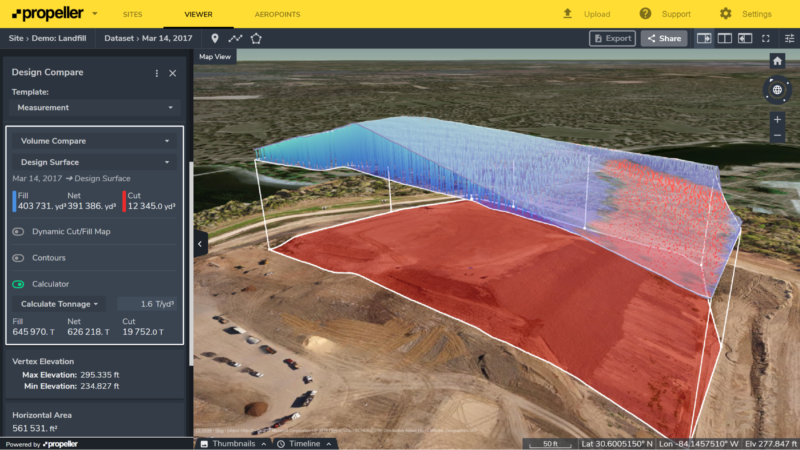
    3D visualization of a landfill airspace

    Learn more about improving landfill performance with Propeller.

    Comparing volume to design

    Estimating cut and fill at the start of a job is one thing. Getting reliable, accurate progress reports quickly and cost-effectively throughout the project is why so many earthwork teams choose Propeller.

    Here you can see a subdivision job comparing the current terrain to the design, with values summed up in the left panel.

    We’ve also switched on the Dynamic Cut/Fill Map to show exactly where dirt needs to come from and go to.
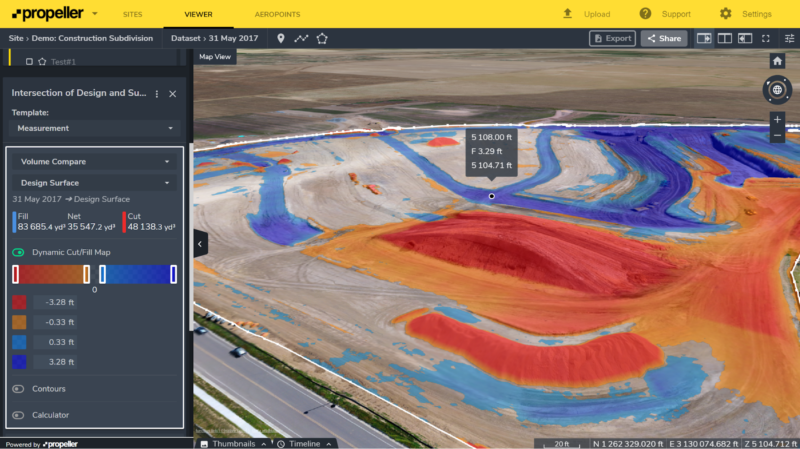
    Compare terrain against design

    Learn more about keeping your construction site close to the design.

    Safely measuring tailings dams

    Tailings dams are difficult to measure accurately while keeping your surveyors safe. Provided there isn’t too much water on site, drones and Propeller make it straightforward.

    Below you can see a comparison between two points in time at a tailings dam. Blue is where filling has occurred and red is where it hasn’t. We’ve also turned on contours to make the change clearer.
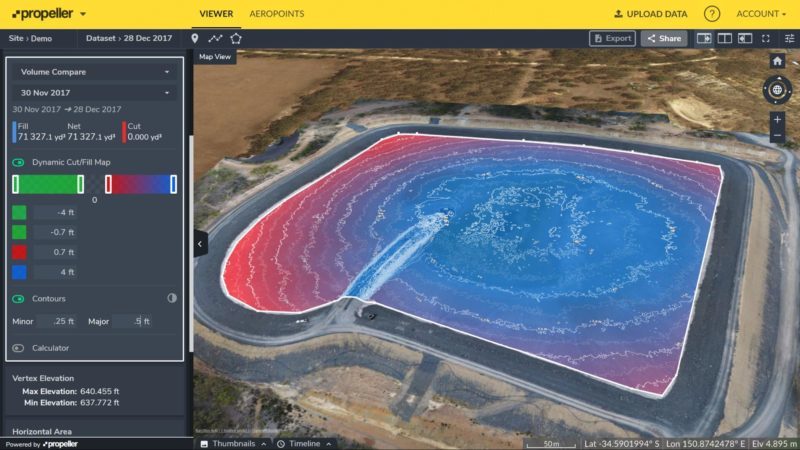
    Tailings dam measurement using drone data

    Use cases: Reference Level Volume

    Reference level volume intro

    There are some powerful things you can do with reference level volume calculations. Here are the main ones.

    Blast volume estimating

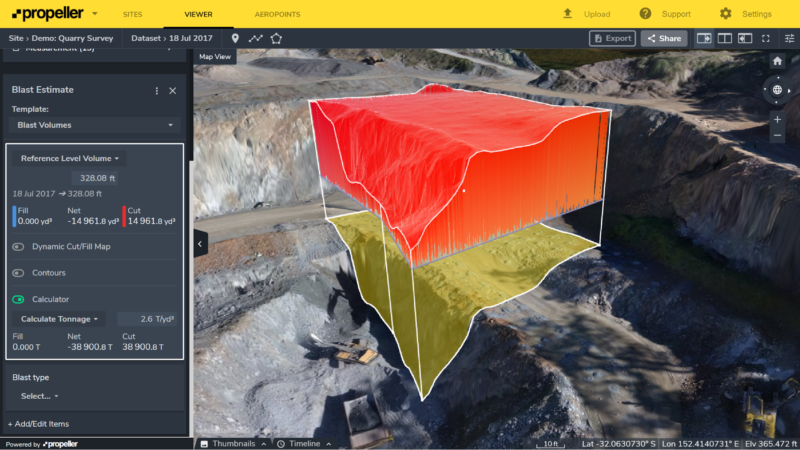
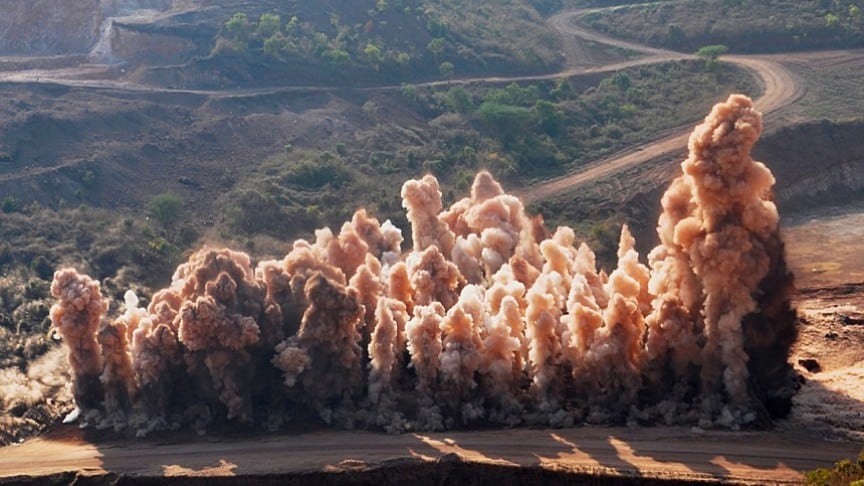
    Pre- and post-blast volume calculations can both be done with Propeller. Outline the drill pattern or blasted dirt, set the tool to an appropriate reference level, and you’re good to go.

    Blast volume measurement using drone data

    Learn more about using Propeller for blast planning and monitoring.

    Forecasting pit flooding and backfill

    Need to find out how much water or backfill you can fit in a pit? Roughly trace around the pit, set the reference level to the desired height, and Propeller calculates the fill volume between the pit floor and the selected level. This is visualized in blue in the image below.

    Pit flooding forecast

    Leveling off

    To build on an area, you often need to cut down to the lowest point first.

    That’s exactly what the reference level volume tool calculates by default. Trace around the area and it cuts down to the lowest selected point, giving you an accurate estimate of how much material needs to be removed.

    Construction level off

    The list of applications goes on, but hopefully this has you thinking beyond stockpile volumes about what’s possible with Propeller.

    If you want to measure volume fast, accurately, and easily, see how Propeller’s volume tools work.

    Quick links

      Related articles

      Better blast planning, monitoring and quarry reporting using drone data

      Propeller gives mining teams accurate pre- and postblast site data by combining high-precision drone surveys…

      Six smart ways to use drones in mines and quarries

      The use of drones in mines and quarries is common, but these sites are highly…

      Cross section survey in a matter of minutes using drone data

      With the power of drone-captured data and the Propeller Platform, surveying cross sections becomes as…

      Ready to learn how Propeller can power up your worksite?

      We’re happy to show you how Propeller can power your worksite, and boost productivity.

      Related articles

      Better blast planning, monitoring and quarry reporting using drone data

      Propeller gives mining teams accurate pre- and postblast site data by combining high-precision drone surveys…

      Using Drone Data to Visualize and Measure Coastline Erosion

      It’s vital for governments and environmental protection organizations to monitor and measure coastline erosion and modification…

      Scheffer Andrew Uses Drone Data to Report on Environmental and Safety Concerns in Canada

      Scheffer Andrew Ltd. Planner and Engineers is a leading supplier of professional engineering and municipal planning…