How to compare as-built conditions to design plans

Read Time: 8 mins
Quick links
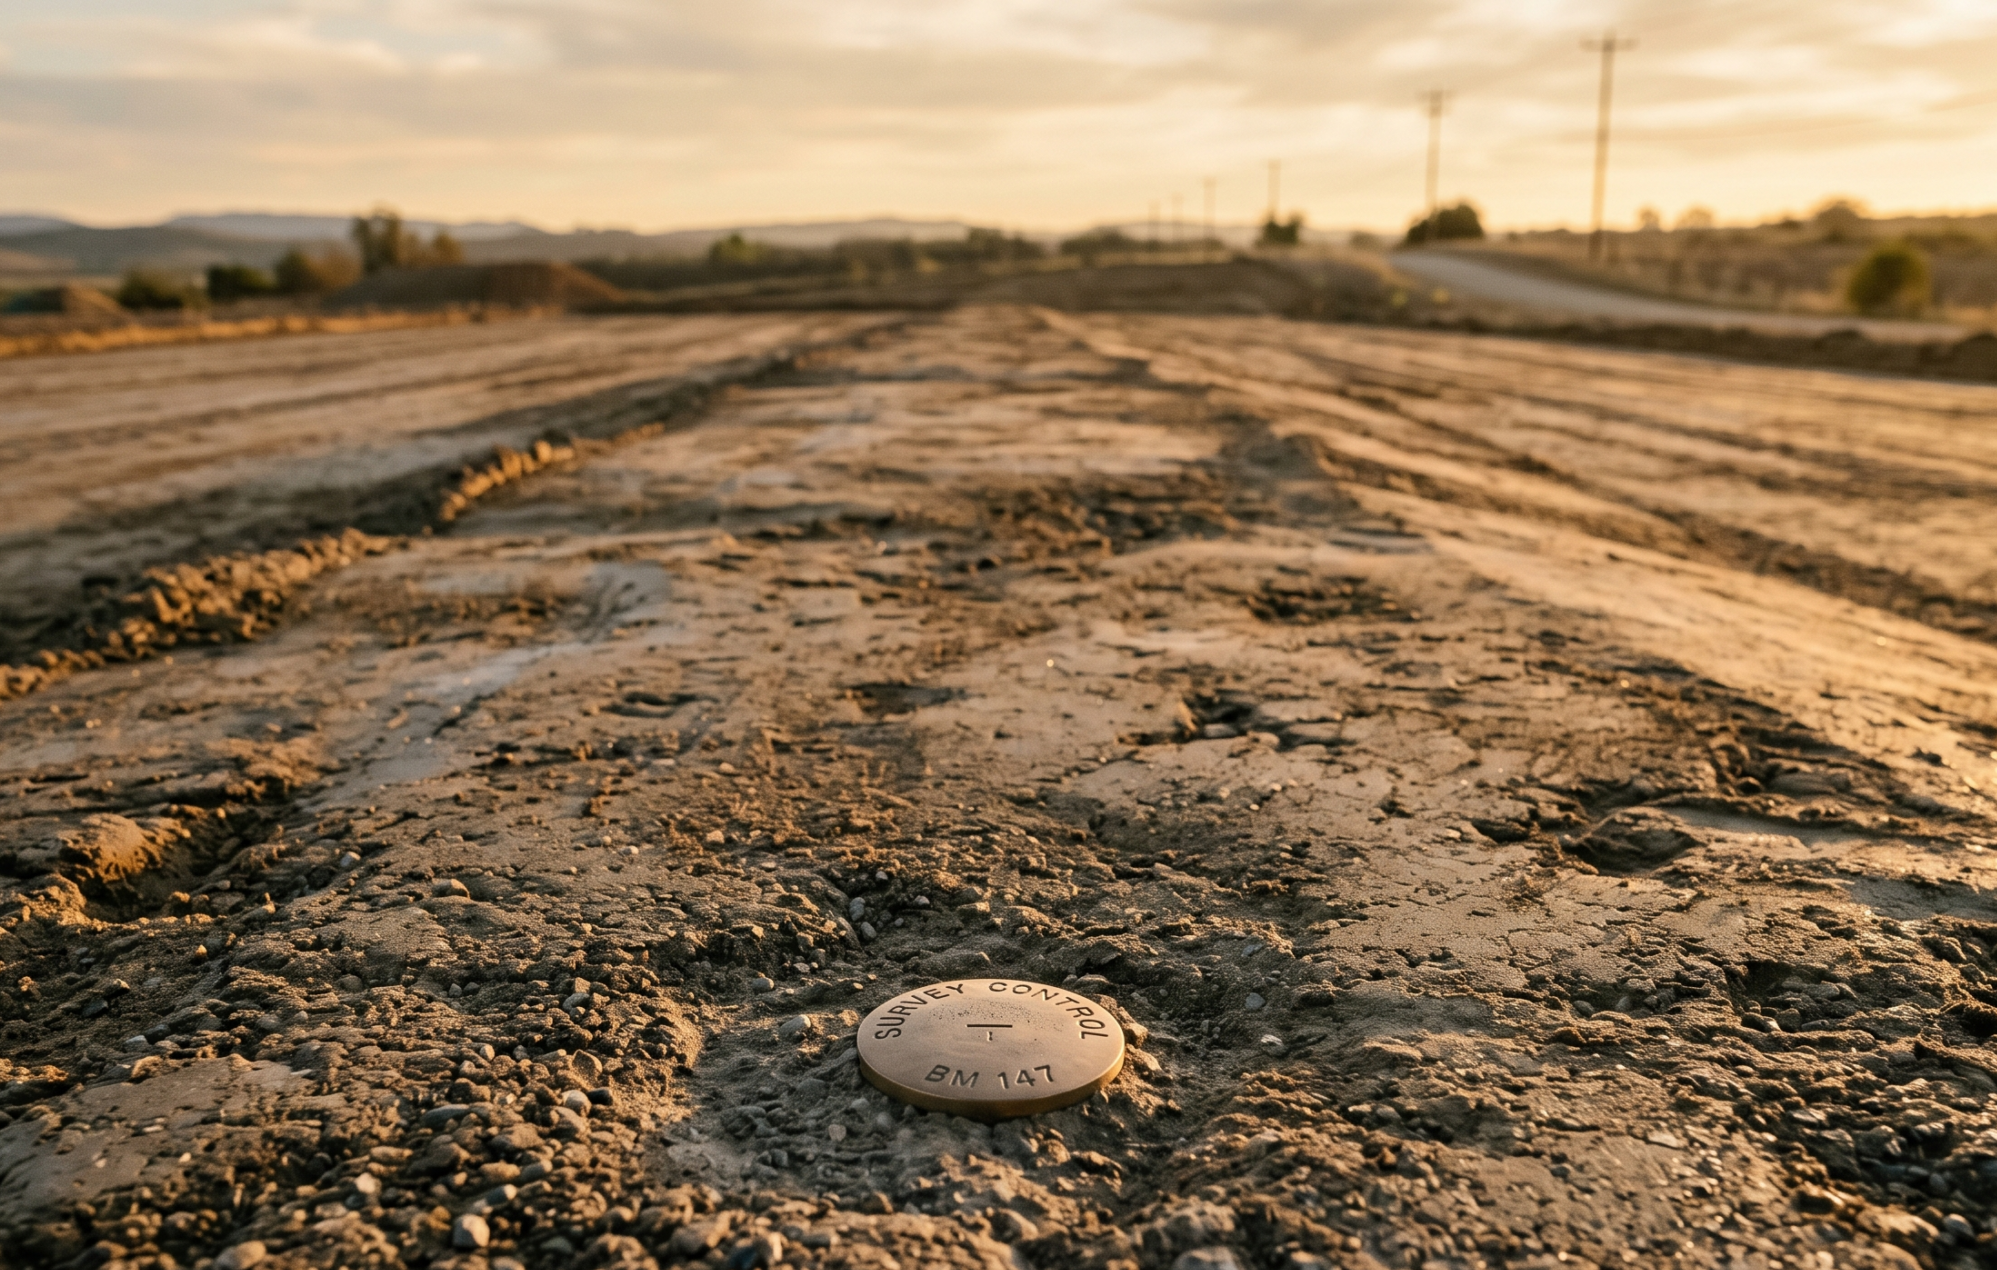
    Low-angle view of a freshly graded construction subgrade with a survey control disc in the foreground

    A step-by-step walk through comparing current site conditions against the approved design, from getting your survey, design file, and coordinate reference lined up to running the comparison and turning the result into shareable evidence.

    A site can look ready for sign-off while still containing elevation, slope, or volume deviations that are difficult to see from the ground. Comparing current survey data with the approved design surface makes those differences measurable before work is buried, paved, handed over, or submitted for payment.

    This guide explains the data, file formats, comparison methods, and reporting steps involved in an as-built vs. design workflow, with a focus on civil construction earthworks.

    What is an as-built vs. design comparison?

    An as-built vs. design comparison measures current site conditions against an approved design surface or plan. Teams use it to identify differences in elevation, grade, slope, alignment, and material volume before sign-off or handover.

    Three concepts matter:

    • Design: the intended condition represented by a CAD drawing, alignment, model, or surface
    • As-built condition: what is physically present on site at a specific date
    • Variance: the measurable difference between the design and the as-built condition

    A useful comparison does more than show a drawing on top of a map. It helps a team understand whether the work on the ground matches the intended surface, and where follow-up is needed before the next phase begins.

    What data do you need to compare the site with the design?

    Teams need three inputs: a current survey, the approved design file or target surface, and a shared coordinate reference. If any one of those inputs is wrong, the comparison can produce misleading variance.

    A current, accurately positioned site survey

    The comparison starts with an accurate representation of current site conditions. That may come from drone photogrammetry, rover or GNSS survey data, or another ground-based capture method.

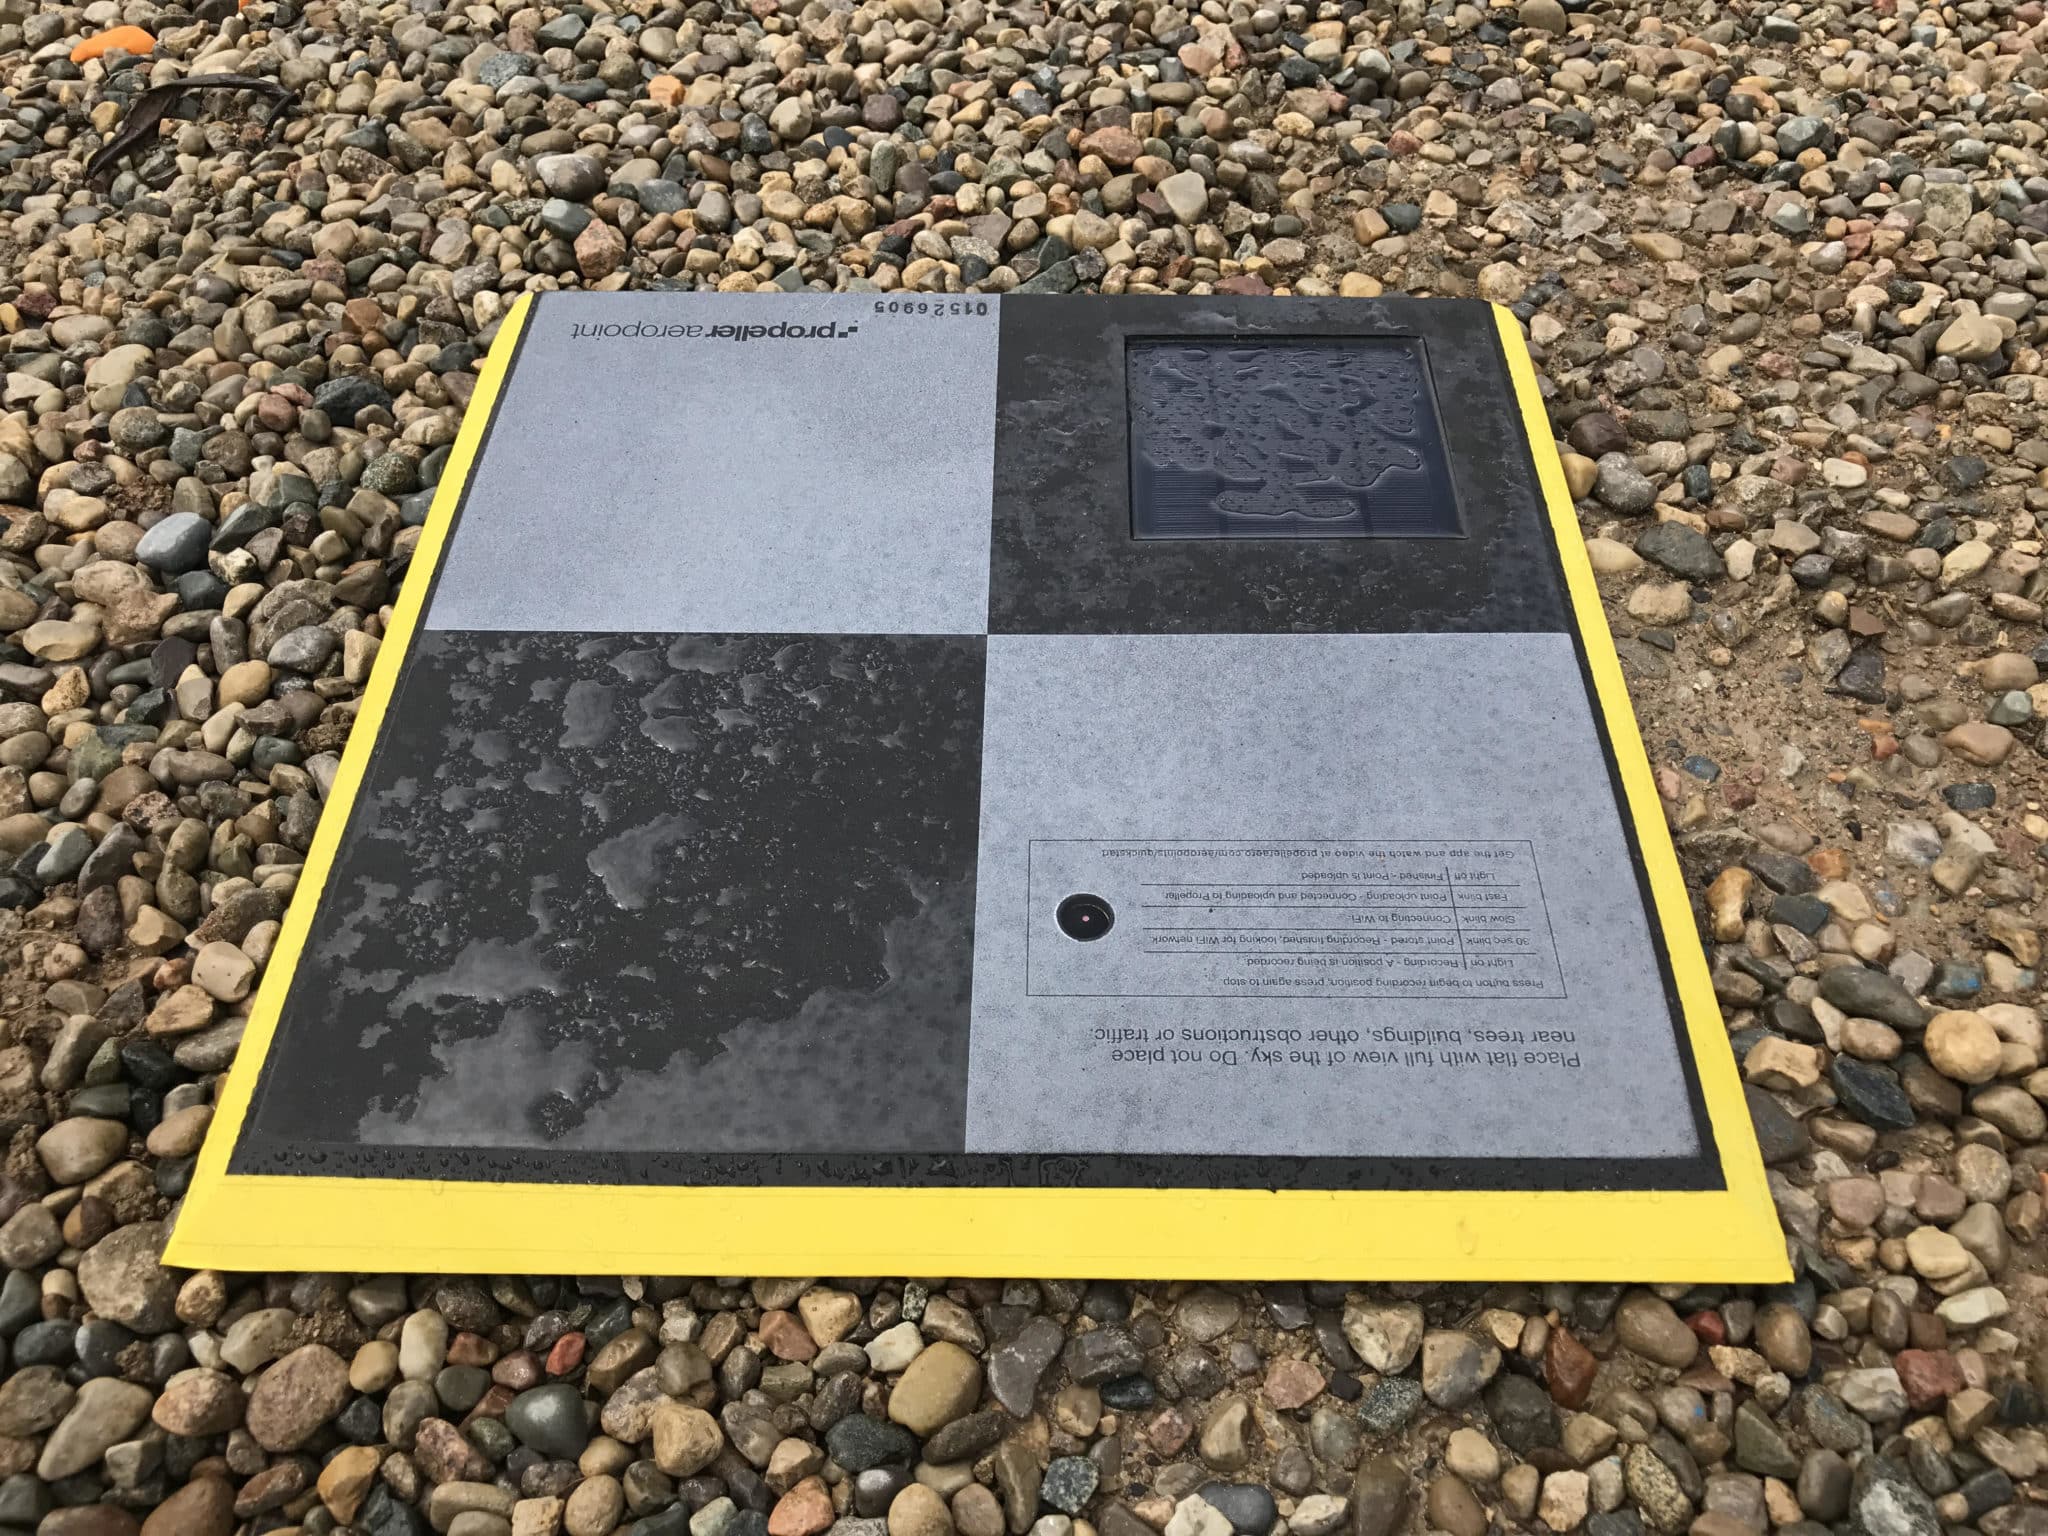
    What matters most is whether the data is accurately positioned to the site coordinate system, backed by repeatable control from tools like AeroPoints, and tied to a known survey date.

    A good survey record should make it clear:

    • When the data was captured
    • Which control or checkpoints were used
    • Which coordinate reference was applied
    • Whether the data represents the whole site or a specific work area
    • Whether the survey is suitable for the decision being made

    The approved design file or target surface

    The design file defines the target condition. Depending on the workflow, that may be a DXF, LandXML, TTM, IFC, PDF, or KML/KMZ file.

    Those formats do not all serve the same purpose:

    • A PDF or 2D drawing may provide visual context
    • A design surface contains elevation information required for true surface comparison
    • Alignments support corridor-based checks
    • A 3D model may support visual verification, but may not replace a civil terrain surface

    That distinction matters. A team can overlay a plan and still lack the elevation data needed to calculate how far the built surface differs from the approved design.

    A shared coordinate reference

    The survey and design need to occupy the same horizontal and vertical reference system. A small offset can make an otherwise accurate comparison show widespread false variance.

    Before running the comparison, teams should confirm:

    • Local site grid
    • Horizontal alignment
    • Vertical datum or elevation reference
    • Calibration files
    • Units
    • Design version
    • Survey version

    This is where the reliability of the workflow is won or lost. If the survey and design do not describe the same location and elevation reference, the heatmap may be precise but not useful.

    The five-step as-built vs. design workflow

    A reliable as-built vs. design workflow follows five steps: import the design, align it to the current survey, run the surface comparison, investigate the variance, and document the result.

    1. Import the design surface

    Before uploading the design, confirm that the file represents the right target condition. A file may represent subgrade, final grade, a liner, a bench, a road, or another phase-specific surface.

    Check:

    • Correct design revision
    • File units
    • Coordinate system
    • Surface limits
    • Intended phase or target surface
    • Whether the file contains elevation data

    Closeout risk: comparing the site with an outdated design revision can produce a technically accurate but operationally irrelevant result.

    2. Align the design with the current survey

    Visual alignment is not enough. A design can appear to sit correctly over an orthomosaic while still being horizontally or vertically offset from the survey surface.

    Teams should validate:

    • Horizontal alignment
    • Vertical reference
    • Site calibration
    • Local coordinate system
    • Known elevations or checkpoints

    A small test area can help confirm that the datasets are aligned before a full comparison is used for operational decisions.

    3. Run the surface comparison

    A surface comparison calculates the difference between the current site surface and the target design surface.

    Common outputs include:

    • Cut areas
    • Fill areas
    • Elevation differences
    • Volume differences
    • Tolerance bands
    • Point-based grade checks

    Use “current” or “up-to-date” when describing survey data. Reserve “real-time” for cases where the data source and use case support that claim.

    4. Investigate the variance

    A heatmap shows where to look. It does not automatically explain what caused the variance or who is responsible for it.

    Use the output to ask:

    • Is the correct design version being used?
    • Is the discrepancy outside tolerance?
    • Is the issue localized or site-wide?
    • Could the variance be caused by incomplete work, rework, changed scope, or data alignment?
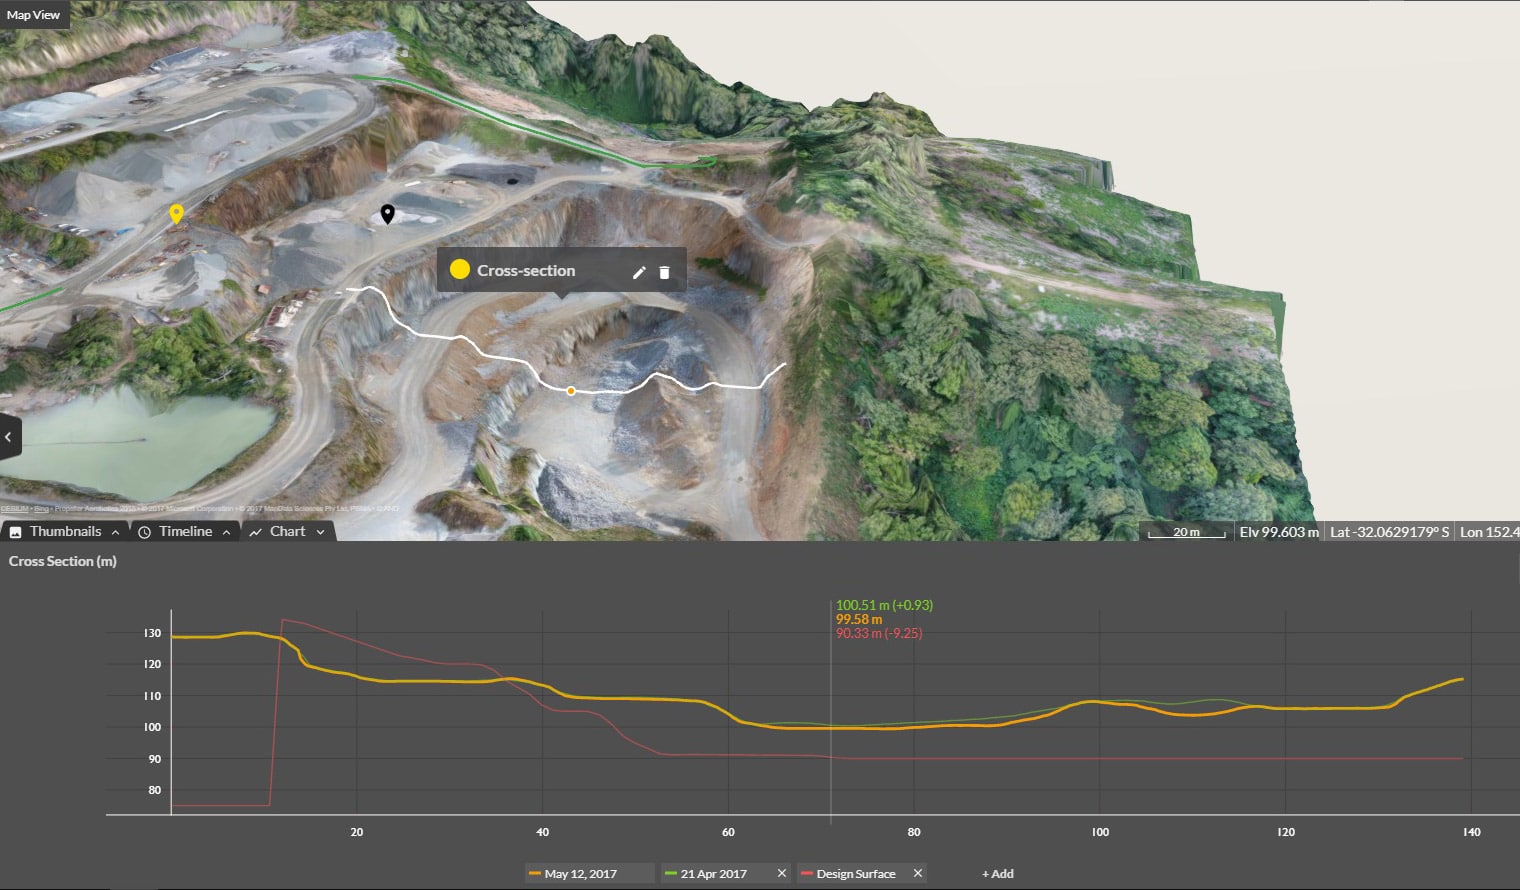
    • Does a cross-section confirm the heatmap?
    • Is field context needed before action is taken?

    This step turns a visual output into a decision. The aim is to understand which areas need correction, review, or documentation, rather than simply spotting red or blue.

    5. Document and share the result

    A usable variance report should give reviewers enough context to understand what was compared and why the result matters.

    Include:

    • Survey date
    • Design revision
    • Comparison area
    • Coordinate reference
    • Tolerance used
    • Cut and fill results
    • Annotated areas
    • Cross-sections
    • Reviewer or approver
    • Supporting photos or field context
    • Exported report

    This documentation can support phase sign-off, handover, payment review, change orders, progress verification, dispute avoidance, and closeout records.
    Which comparison method answers which question?

    Different analysis methods answer different operational questions. A heatmap may show the broad pattern, while a cross-section or point check can confirm what is happening at a specific location.

    Question Best analysis
    Is the entire area above or below target grade? Surface-to-design heatmap
    Does a road, trench, or bench match the intended profile? Cross-section
    How much cut or fill remains? Surface comparison and volume calculation
    Is a specific location within tolerance? Point elevation or grade check
    How has conformance changed since the last survey? Historical survey comparison
    Can the result support closeout review? Timestamped variance report with design revision and survey source

    Common reasons as-built comparisons produce misleading results

    As-built comparisons usually become misleading when the survey, design, coordinate reference, or intended target surface is wrong. The output may look convincing, but the underlying setup can still point the team in the wrong direction.

    The survey and design use different coordinate systems

    If the datasets do not share the same horizontal reference, the design may shift across the survey. This can create apparent variance that is actually an alignment problem.

    The wrong vertical datum or calibration is applied

    A vertical offset can make an entire site appear too high or too low. Before acting on widespread variance, check the benchmark, datum, calibration, and known elevations.

    The design file contains lines but no usable elevation surface

    A drawing may show where work belongs without providing the surface needed to calculate elevation differences. A map overlay can show where the design sits. It does not necessarily calculate how far the built surface differs from the design.

    The team compares against an outdated design revision

    If the site has changed but the comparison uses an old design, the result may be technically correct against the wrong target.

    The comparison area includes unfinished or irrelevant ground

    Including areas outside the intended work zone can make the result harder to interpret. Define the comparison area around the operational question.

    Tolerance bands are too broad or too narrow

    Tolerance settings should reflect the decision being made. A tolerance that is too broad can hide meaningful variance. A tolerance that is too narrow can create noise.

    The workflow stops at a visual overlay

    A visual overlay helps with orientation. It does not replace a surface comparison, grade check, or cross-section when the question involves elevation or volume.

    When should teams run a design comparison?

    Teams should run a design comparison before a decision depends on the work matching the approved target condition. The most useful comparison often happens before the phase is considered complete, while the work and its context are still visible.

    Useful moments include:

    • Before work begins, to verify the baseline and capture existing ground
    • During excavation or grading
    • Before material is buried
    • Before paving or concrete placement
    • Before subcontractor valuation or payment review
    • At the end of each phase
    • Before final handover or practical completion

    The earlier the variance is visible, the easier it is to investigate while field context is still available.

    How different teams use the same comparison

    The same comparison can support different decisions across the project team. Surveyors may focus on alignment and data integrity, while project managers use the result to coordinate work and document progress.

    Surveyors and GIS leads

    Survey and GIS teams protect the integrity of the data. They validate alignment, confirm control, check file structure, and make sure the comparison is based on the right coordinate reference. Clean survey processing keeps that foundation solid.

    Project managers and site engineers

    Project managers and site engineers use comparison outputs to identify variance, confirm scope, coordinate correction, and support phase-level decisions.

    Foremen and superintendents

    Field teams need clear, visual outputs that show where to act. Heatmaps, annotations, and cross-sections can help translate the comparison into practical work direction, and field collaboration keeps everyone working from the same map.

    Commercial and leadership teams

    Commercial and leadership teams use documented results for closeout, payment review, change-order discussions, and stakeholder reporting.

    Worked example: catching a subgrade issue before the next phase

    A crew completes a subgrade surface before base course placement. The site looks ready from the ground, but the team compares the latest survey with the approved subgrade design before moving forward.

    The heatmap shows a localized high area. A cross-section confirms that the issue is outside tolerance. The crew corrects the area before the next phase begins, and the exported report is retained with the closeout record.

    The value goes beyond finding the issue. The team also has a record showing the survey date, design revision, comparison area, and evidence used to support the decision.

    How Propeller supports the workflow

    Propeller supports the design conformance workflow by bringing supported design files and high-precision site data into one cloud environment. Teams can view design and actual conditions together, compare surfaces, inspect variance, and export evidence for review.

    The workflow can support:

    • Importing supported civil and design files
    • Aligning designs with high-precision site data
    • Viewing design and actual conditions together
    • Using heatmaps, grade checks, measurements, and cross-sections
    • Comparing surveys over time
    • Exporting and sharing evidence for review

    See the full product narrative on the design conformance solution page.

    See how your site compares with the design

    Import your design surface, compare it with current survey data, and turn visible variance into shareable evidence.

    See design conformance on your site

    Frequently asked questions

    To compare as-built data with design files, capture a current site survey, import the approved design file or target surface, align both datasets to the same coordinate and vertical reference, then run a surface comparison. Review heatmaps, cross-sections, grade checks, and reports before making decisions.

    Common formats include DXF, LandXML, TTM, IFC, PDF, and KML/KMZ. The file extension alone does not determine whether the file can support elevation comparison. Teams should confirm whether the file contains a usable design surface, visual context, alignment data, or another type of design information.

    Yes, drone survey data can be compared with CAD plans when the survey and design are accurately aligned. A CAD overlay can provide visual context, while a design surface with elevation data can support surface-to-design comparison, cut and fill analysis, cross-sections, and grade checks.

    A CAD overlay places design information over a map or survey for visual reference. A surface comparison calculates elevation differences between the surveyed surface and the target design surface. Overlays help teams see where work belongs, while surface comparisons quantify whether the ground is above, below, or within tolerance.

    Design comparison helps teams find variance before work is buried, paved, handed over, or submitted for payment. By identifying areas that are above or below target grade during the active phase, teams can investigate and correct issues while equipment, crews, and field context are still available.

    An as-built variance report should include the survey date, design revision, comparison area, coordinate reference, tolerance used, cut and fill results, annotated areas, cross-sections, reviewer or approver, supporting photos or field context, and export date. The report should make the comparison traceable and reviewable.

    Yes, as-built comparison can support payment review and change-order discussions when the result is documented clearly. The report should connect the variance output to the survey source, approved design revision, comparison method, tolerance, and relevant field context so stakeholders can review the basis of the claim.

    Quick links

      Related articles

      Better blast planning, monitoring and quarry reporting using drone data

      Propeller gives mining teams accurate pre- and postblast site data by combining high-precision drone surveys…

      Six smart ways to use drones in mines and quarries

      The use of drones in mines and quarries is common, but these sites are highly…

      Cross section survey in a matter of minutes using drone data

      With the power of drone-captured data and the Propeller Platform, surveying cross sections becomes as…

      Ready to learn how Propeller can power up your worksite?

      We’re happy to show you how Propeller can power your worksite, and boost productivity.

      Related articles

      Drone pilot in hi-vis flying a drone next to a crane, with an AeroPoint on the floor.

      Things To Know About Ground Control in Drone Surveying

      Ground control is the go-to option for turning drone data into highly accurate, survey-grade models.…
      DJI M4E flying in the sky

      Propeller’s Drone Guide: DJI Solutions for Commercial Operations

      At Propeller we love testing new drone hardware and we are processing hundreds of drone…

      Telecom Tower Inspection using DJI Phantom 4 Pro: Step-by-Step Guide

      A few weeks ago a new DJI Phantom 4 Pro was delivered to our office.…