Real variance or bad data? 4 causes of false cut/fill results to rule out first

Read Time: 6 mins
Quick links

    Before you send a crew back to fix a cut/fill variance, check whether the problem is on site or in the data. This blog walks through coordinate mismatches, vertical drift, outdated designs, and checks made too late to trace the cause, then gives you a five-point checklist to validate the result before committing time and money to rework.⁠

    The survey says you’re off grade. But what if the survey is wrong?

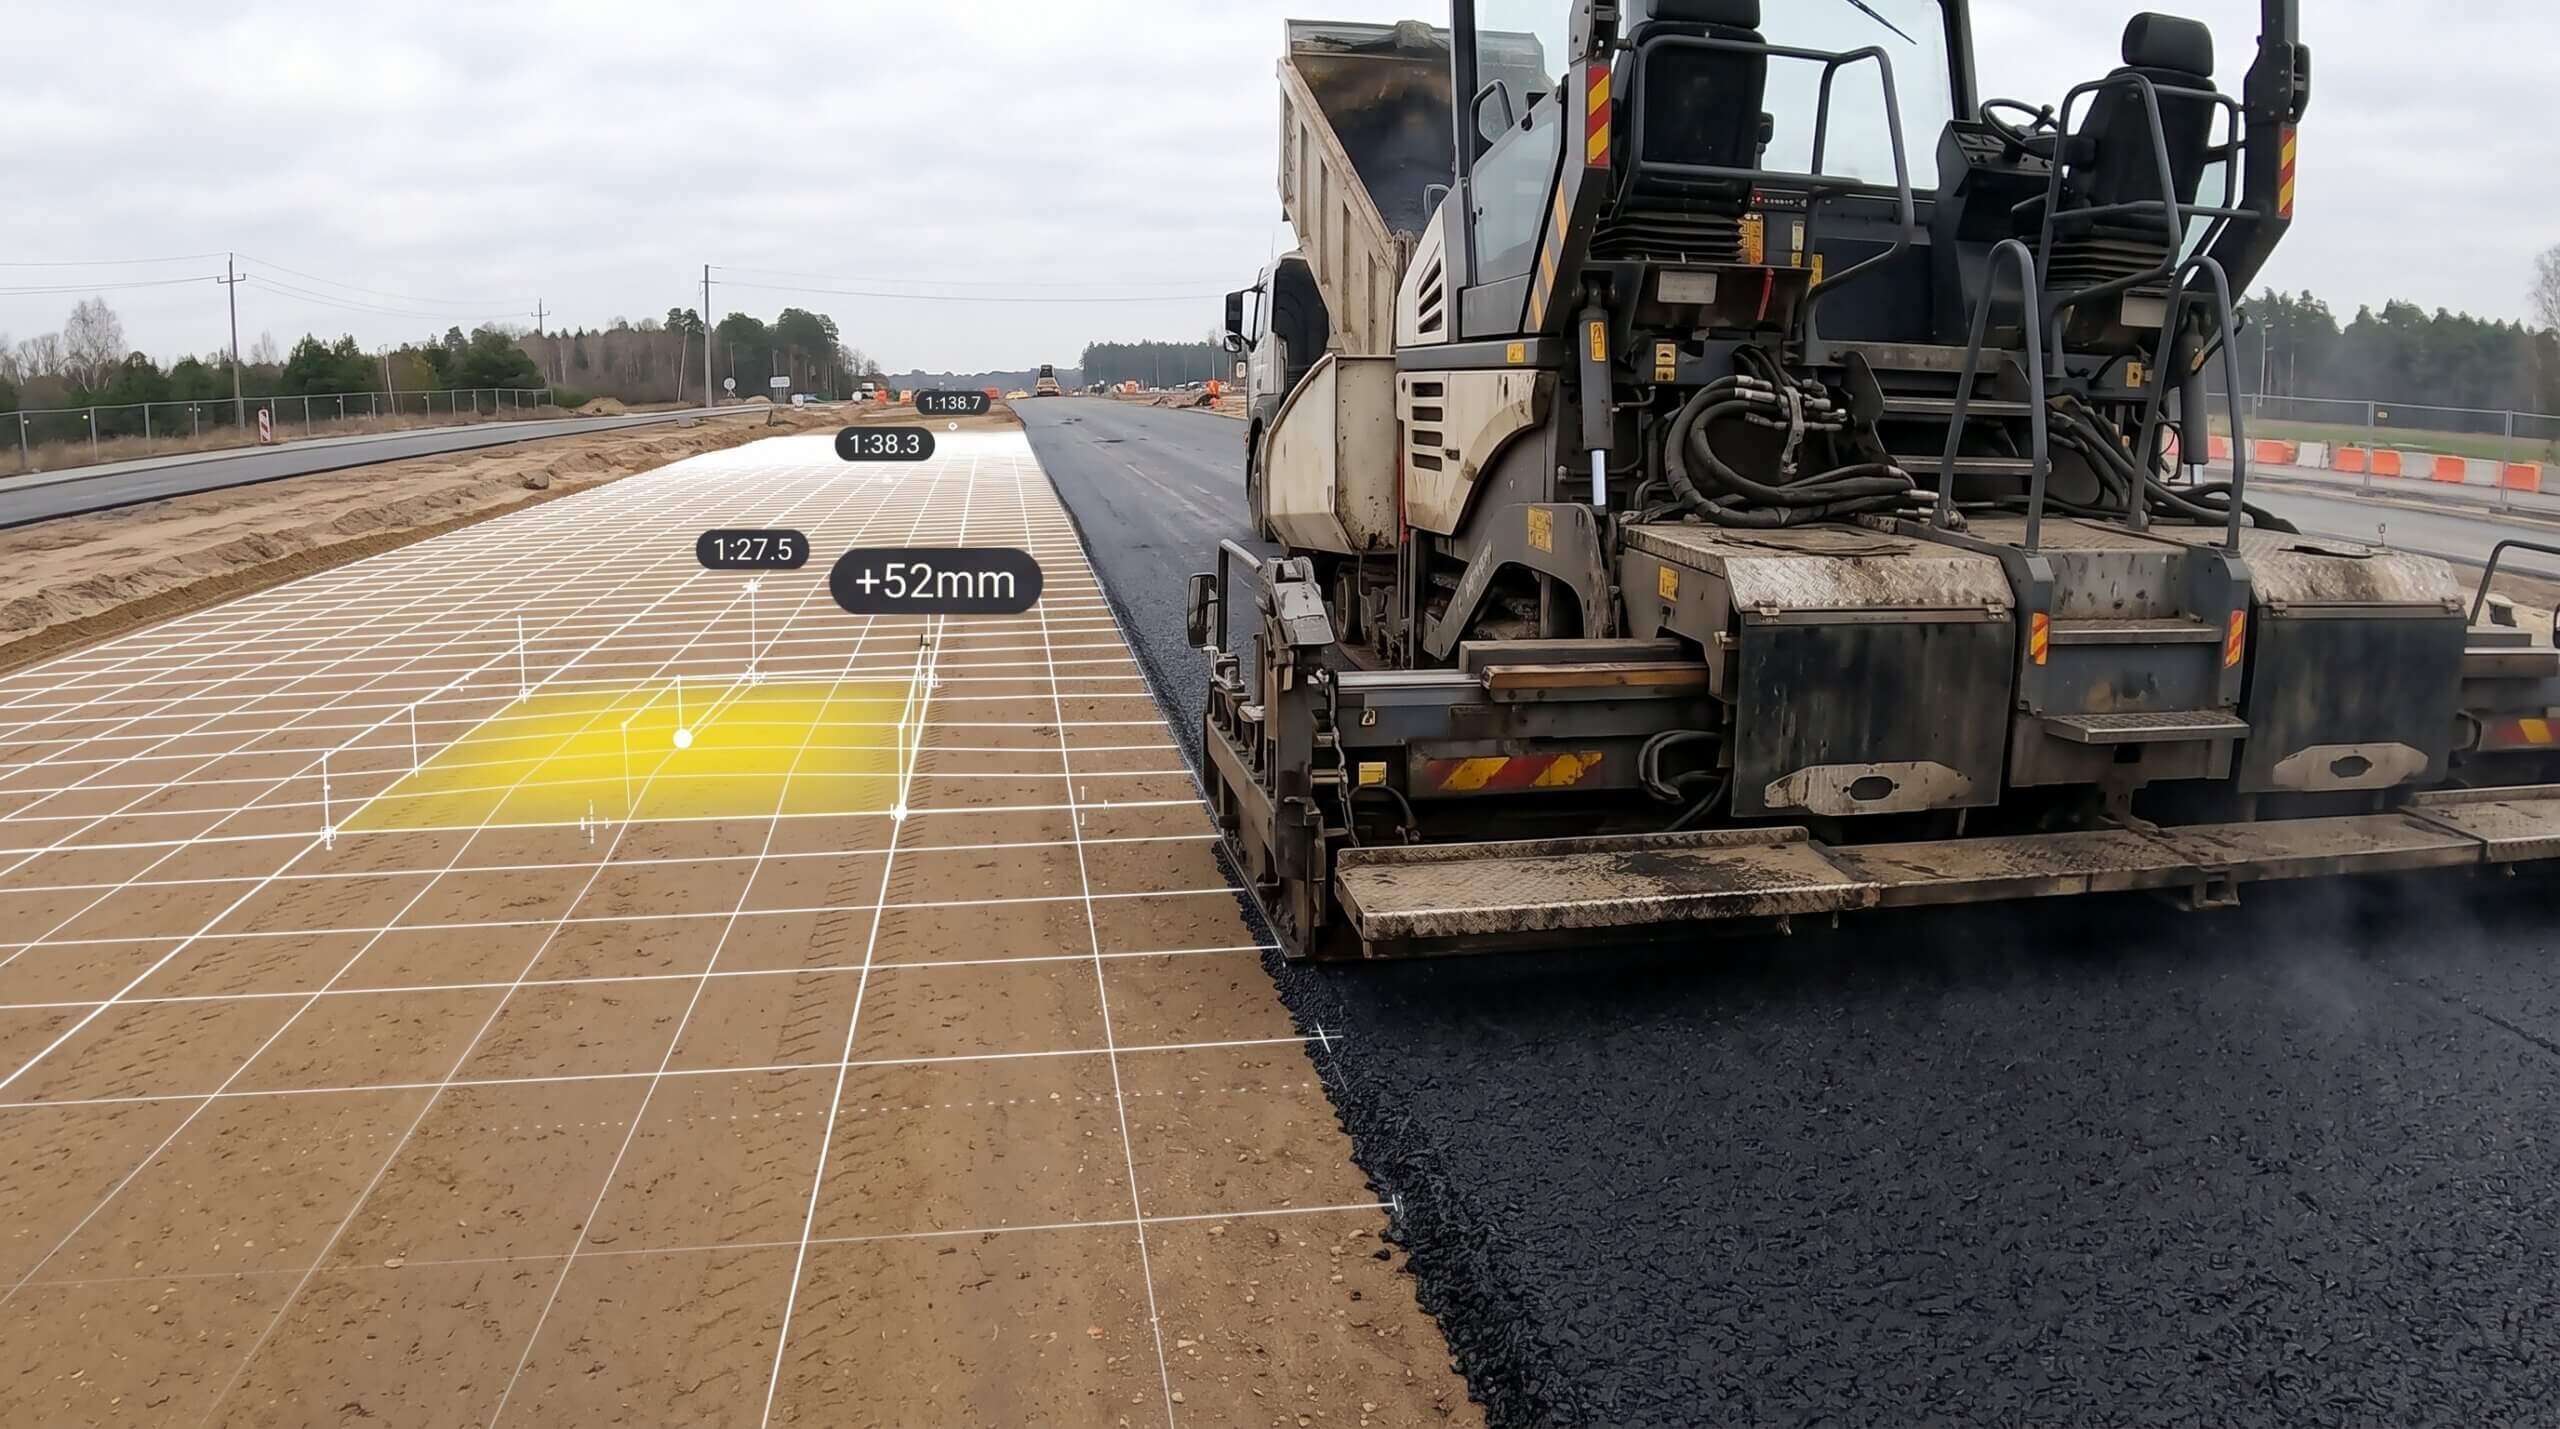
    Your cut/fill comparison came back with a variance that doesn’t make sense. The site is showing high in places the crew reports building to grade. The numbers don’t match the conditions on the ground. Before you start a difficult rework conversation, before you reschedule a crew or call a second survey, there’s one question worth asking first.

    Is the variance real?

    False variance means the comparison shows a problem that doesn’t exist on the site. Start by checking the coordinate system, survey references, and design version before deciding what needs fixing. Acting on false variance is expensive in exactly the same ways as acting on real variance: crew time, mobilization, delay, and the loss of confidence that comes with sending people to fix something that didn’t need fixing.

    The webinar this blog series follows covers how experienced teams validate a variance before acting on it. Here are four checks to help you validate the result.

    Before you send anyone back

    Rule out these four causes first

    1

    Coordinate system mismatch

    Survey and design on different systems or units. Shows as a consistent offset across the whole site.

    2

    Vertical drift between surveys

    GCPs shifted or disturbed. The reference elevation moved, not the site.

    3

    Wrong design version loaded

    Crew built to the new design. Platform is measuring against the old one.

    4

    Checking too late to trace it

    No survey history means you can’t prove when or why the variance appeared.

    Cause 1: The survey and design aren’t on the same coordinate system

    A coordinate system mismatch can create apparent variance across the site rather than in one specific area. If your drone survey and your design file are in different coordinate reference systems, or in the same system but with different units, everything will look misaligned even when the site is perfectly built.

    A few specific versions of this to check:

    Grid coordinates vs ground coordinates. Many design files are created in grid coordinates. Drone survey data is often captured in ground coordinates. On large sites, the difference between the two can be significant enough to produce apparent variance across the whole area. If your design has a ground-to-grid scale factor built in and your survey doesn’t (or vice versa), the comparison will be off.

    US survey foot vs international foot. These are not the same thing. US survey foot is 0.3048006096… metres. International foot is exactly 0.3048 metres. The difference is small per unit, but it compounds across a site and can produce apparent variance that looks like a real grade issue when it isn’t.

    What to check: In Propeller, confirm your calibration file includes the correct ground definition for your site. If your designs are on a ground projection, the calibration file needs to include that definition. The survey manager who set up the site should be able to confirm the coordinate system and scale factor in use. If you’re not sure, the webinar walkthrough shows how to check this in the platform.

    Cause 2: The surveys have drifted vertically over time

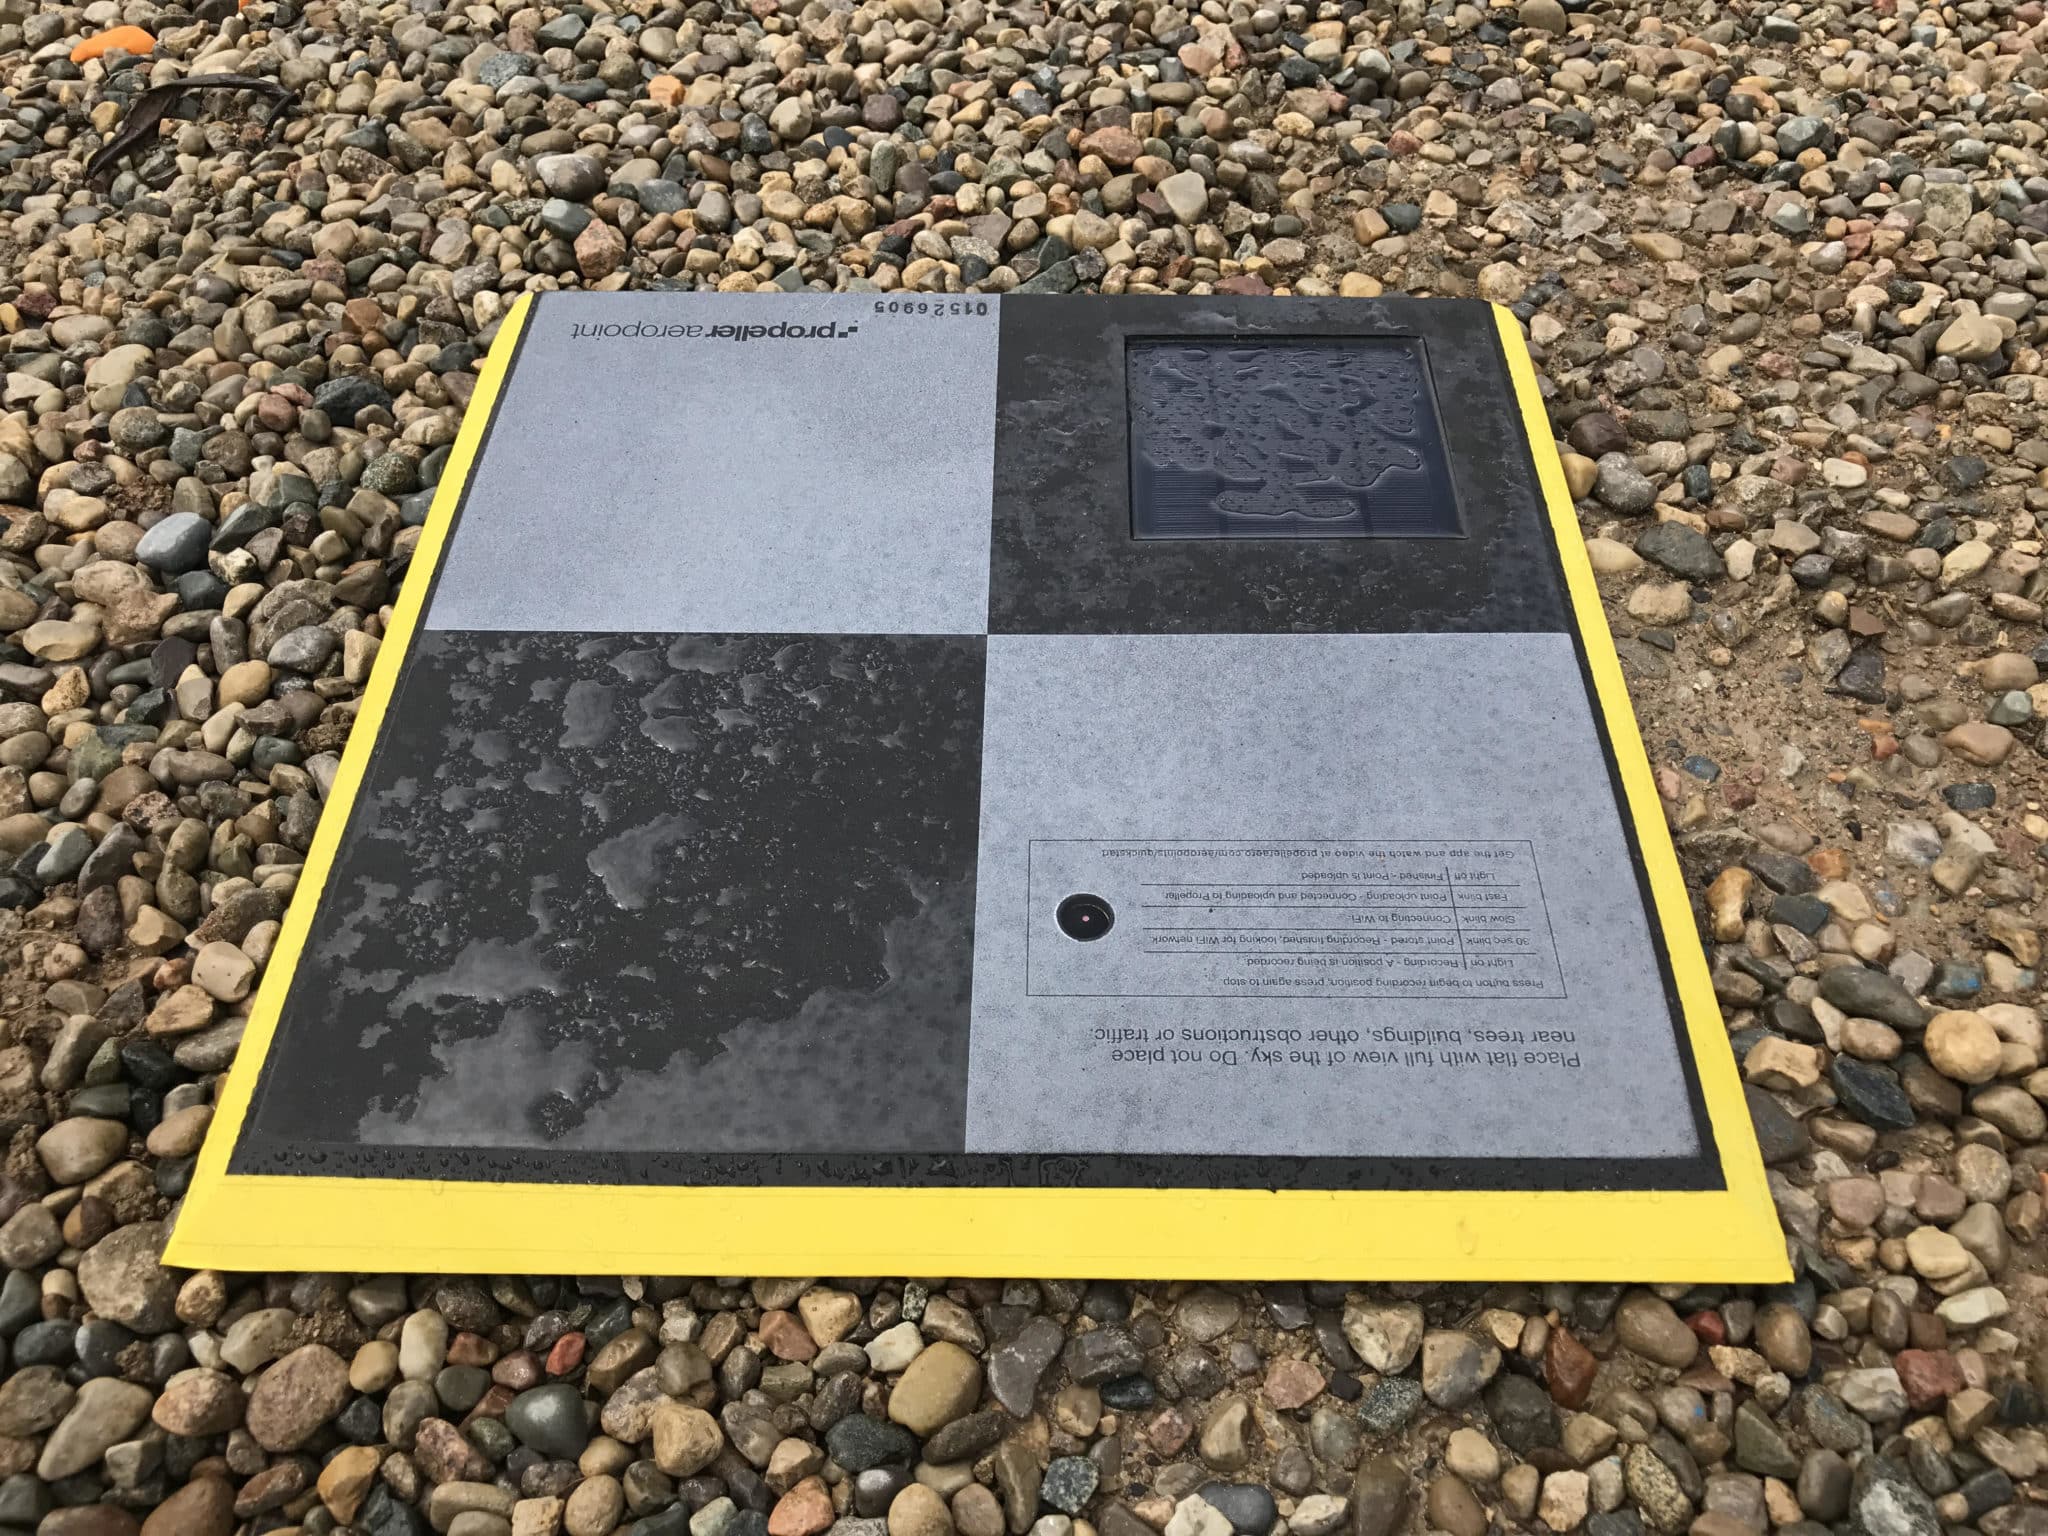
    Ground control isn’t a set-and-forget thing. If your ground control points (GCPs) shift, settle, or get disturbed between surveys, the vertical relationship between your earlier and later captures can drift, even if the drone, the processing, and the platform are all doing exactly what they should.

    This shows up as apparent variance that’s relatively consistent across the site: everything running slightly high or slightly low. It can look like a real grade issue when the actual problem is that your reference elevation has moved.

    What to check: Compare a stable, well-understood reference point (a check shot, a known benchmark, or a control point from the original survey setup) across your recent captures. If that reference point is showing a shift, your vertical relationship between surveys has drifted and the comparison needs to be re-anchored, not acted on as-is. Re-survey the GCPs, confirm your check shots, and reprocess before making any field decisions from the comparison.

    This is also a good reason to include check shots at known elevations in every survey as a matter of routine. They don’t take long to capture and they make this kind of validation trivial. Without them, you’re relying on the comparison itself to detect a problem that’s actually in the reference data.

    Cause 3: You’re comparing against the wrong design version

    Design files change. On most civil projects, the design gets revised multiple times between the original takeoff and final sign-off, sometimes in ways that significantly shift the grades, volumes, and cross-sections the crew is working to.

    If the design file in your conformance platform wasn’t updated when the revision came through, you’re comparing site conditions against a plan that’s no longer the plan. The variance you’re seeing might be the crew correctly building to the new design while the platform is measuring against the old one.

    What to check: Confirm the design version currently loaded in Propeller matches the latest issued-for-construction file. Check the revision date, the file name, and where possible the source. Design files should come from the engineer of record or the project’s document control system, not from a downloaded copy that might be an earlier version. If there’s been a revision since the file was loaded, update it before running the conformance check.

    Design version control is one of the most underrated parts of a reliable conformance workflow. The design conformance workflow page covers how teams keep this aligned across the project lifecycle.

    Cause 4: You’re checking so late you can’t explain the variance even if it’s real

    This one is a little different. The variance might be real. But if you’re running your first design conformance check at phase closeout, you’ve lost the ability to trace when the issue appeared, what was happening on site at the time, and whether it was caused by a design revision, a coordinate issue, or actual construction error.

    Without a survey history, it’s harder to establish when the variance appeared. Earlier captures help you check whether it developed during this phase, was present before work started, or followed a design revision.

    That’s why the teams who catch variance early, who run regular checks throughout the project, are also the teams who handle late discoveries with far less friction. They have the timeline. They have the data. They can show exactly when the variance appeared, what the site looked like before and after, and what was happening during that window.

    For more on what a regular conformance check workflow actually looks like, the step-by-step guide covers it from calibration through to exported report. And why late discovery costs more gets into the cost side of that same issue.

    Before you act on a variance: Five checks

    All five pass? You’re likely looking at real variance. Any of the first three fail? Fix the data first.

    Check What to look for If it fails
    Coordinate system Survey and design on same system and units Reload calibration file, confirm ground definition
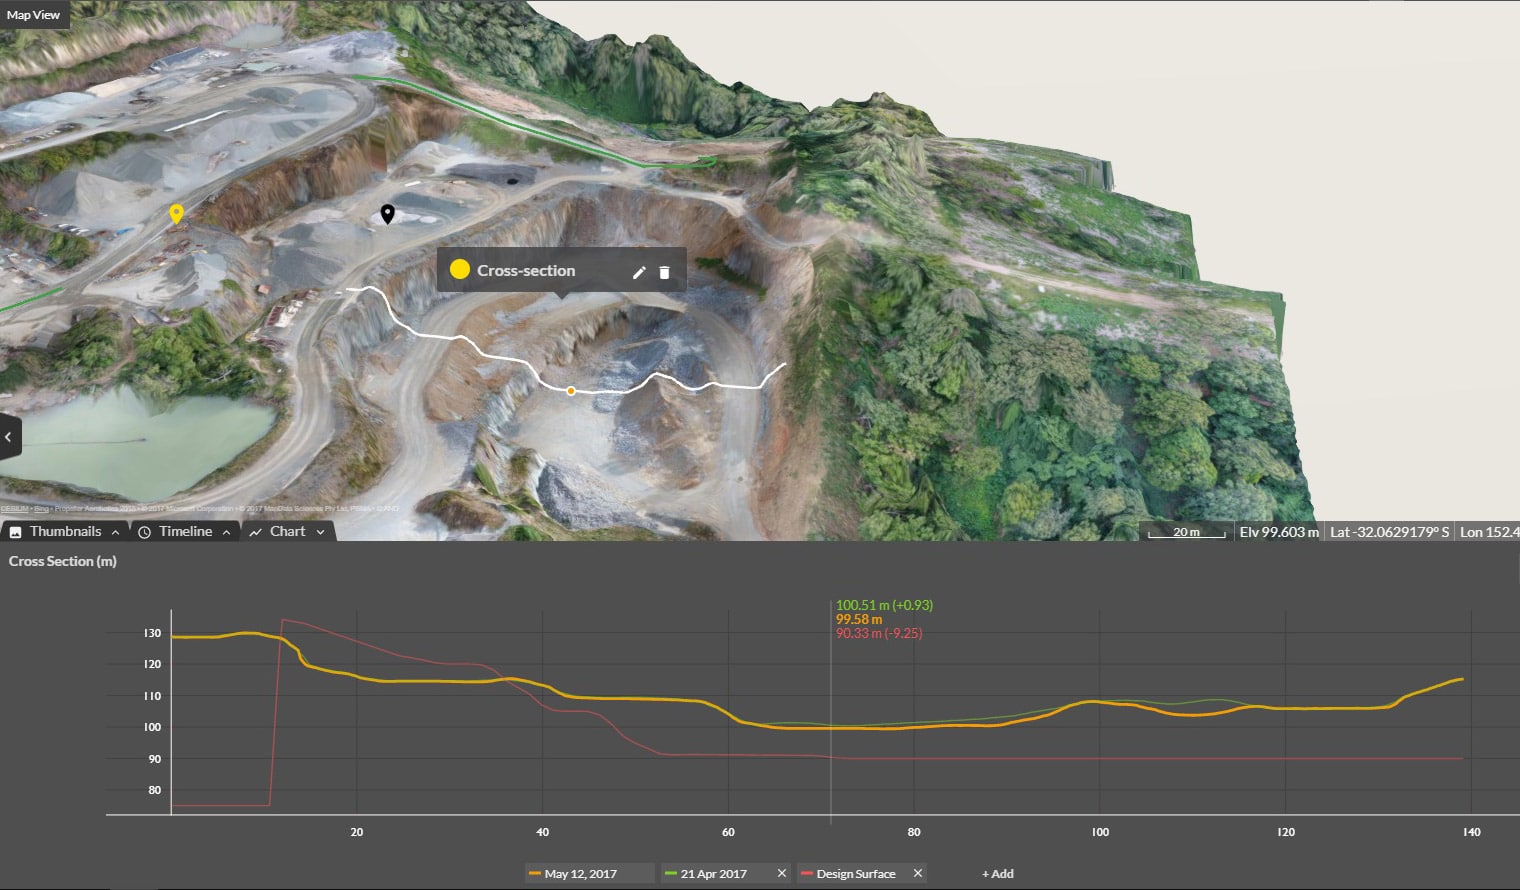
    Vertical reference Check shots at known benchmarks match Re-survey GCPs, reprocess before acting
    Design version File matches latest issued-for-construction revision Update to current revision, then re-run
    Survey history At least one comparison from earlier in the phase Review earlier records to establish when the variance appeared
    Variance pattern Localised area vs consistent offset across the whole site Site-wide pattern suggests coordinate or calibration issue

    If all five checks come back clean and the variance is localized to a specific area, you’re probably looking at real ground conditions. If any of the first three fail, fix the data before you act on the variance.

    Watch the full walkthrough on demand

    Watch on demand: From design to defensible: Catching variance before it’s buried covers the grid vs ground Q&A, the calibration file walkthrough, and the live platform demonstration from this blog, all in one place. Free to watch any time.


    Not sure where to start with your own conformance setup? Take the readiness quiz. Two minutes, clear output.

    Frequently asked questions

    Coordinate system mismatches (including grid vs ground and unit differences), vertical drift between surveys, and outdated design versions can create false variance. Checking only at closeout makes it harder to trace the cause of a variance, even when it is real. Ruling these out before acting on a variance result can save significant crew time and cost.

    Grid coordinates are based on a projected coordinate system and include a scale factor that distorts distances slightly compared to measurements on the actual ground. Ground coordinates remove that scale factor so measurements match real-world distances. On large sites, the difference matters. If your design is in grid and your survey is in ground (or vice versa), the comparison will show apparent variance even when the site is built correctly.

    Your calibration file (JXL, CAL, GC3, or similar depending on your equipment) carries the site’s coordinate definition including projection, scale, and rotation. If your designs are on a ground projection, that definition needs to be in the calibration file. Your surveyor should be able to confirm this. In Propeller, the calibration file is applied when the site is created. Check with whoever set it up originally.

    Include check shots at known benchmarks or stable control points in each survey. Compare those check shots across your survey captures. If a stable reference point is showing a shift between surveys, your vertical relationship has drifted and needs to be re-anchored before the comparison result means anything.

    Propeller supports DXF, LandXML (surfaces and alignments), TTM, IFC, KML/KMZ, and PDF plan sheets. Upload the design file and overlay it against your current survey data to run the comparison. The design conformance workflow page has more detail on how this works across different site types.

    Quick links

      Related articles

      Family-Owned Business With Large Footprint Sees 10X ROI from Drone Program

      Meet Rory Hall, operations manager and Propeller champion at Grade Tech  About Grade Tech Grade…

      How Colorado-based Lange Land is Leveraging Drone Data to Check Everything in Between

      Established in 2012, Lange Land Surveys (LLS) is a full service land surveying company in…
      Two construction men on site stood next to two trucks.

      10 Construction Project Cost Overrun Statistics You Need to Hear

      Construction projects typically span months or years, and in that time, they involve a lot of…

      Ready to learn how Propeller can power up your worksite?

      We’re happy to show you how Propeller can power your worksite, and boost productivity.

      Related articles

      Cross section survey in a matter of minutes using drone data

      With the power of drone-captured data and the Propeller Platform, surveying cross sections becomes as…

      AeroPoints Help NOAR Technologies Bring Accurate Ground Control to AEC

      NOAR Technologies is an AEC (architectural, engineering, and construction) tech solutions provider from Detroit, Michigan.…

      A Surveyor’s Guide to Drones: Selecting the Drone, Camera, and Licenses (Part 1)

      Part One—Hardware Since the invention of the total station in the early ’70s and the…