How to check design conformance on an earthworks site: A step-by-step guide

Read Time: 9 mins
Quick links

    To check design conformance on an earthworks site, align current survey data with the approved design, compare cut/fill and cross-sections, spot-check critical elevations, verify drainage, and export a timestamped report. These checks help teams identify where the site differs from the plan before paving or handoff.
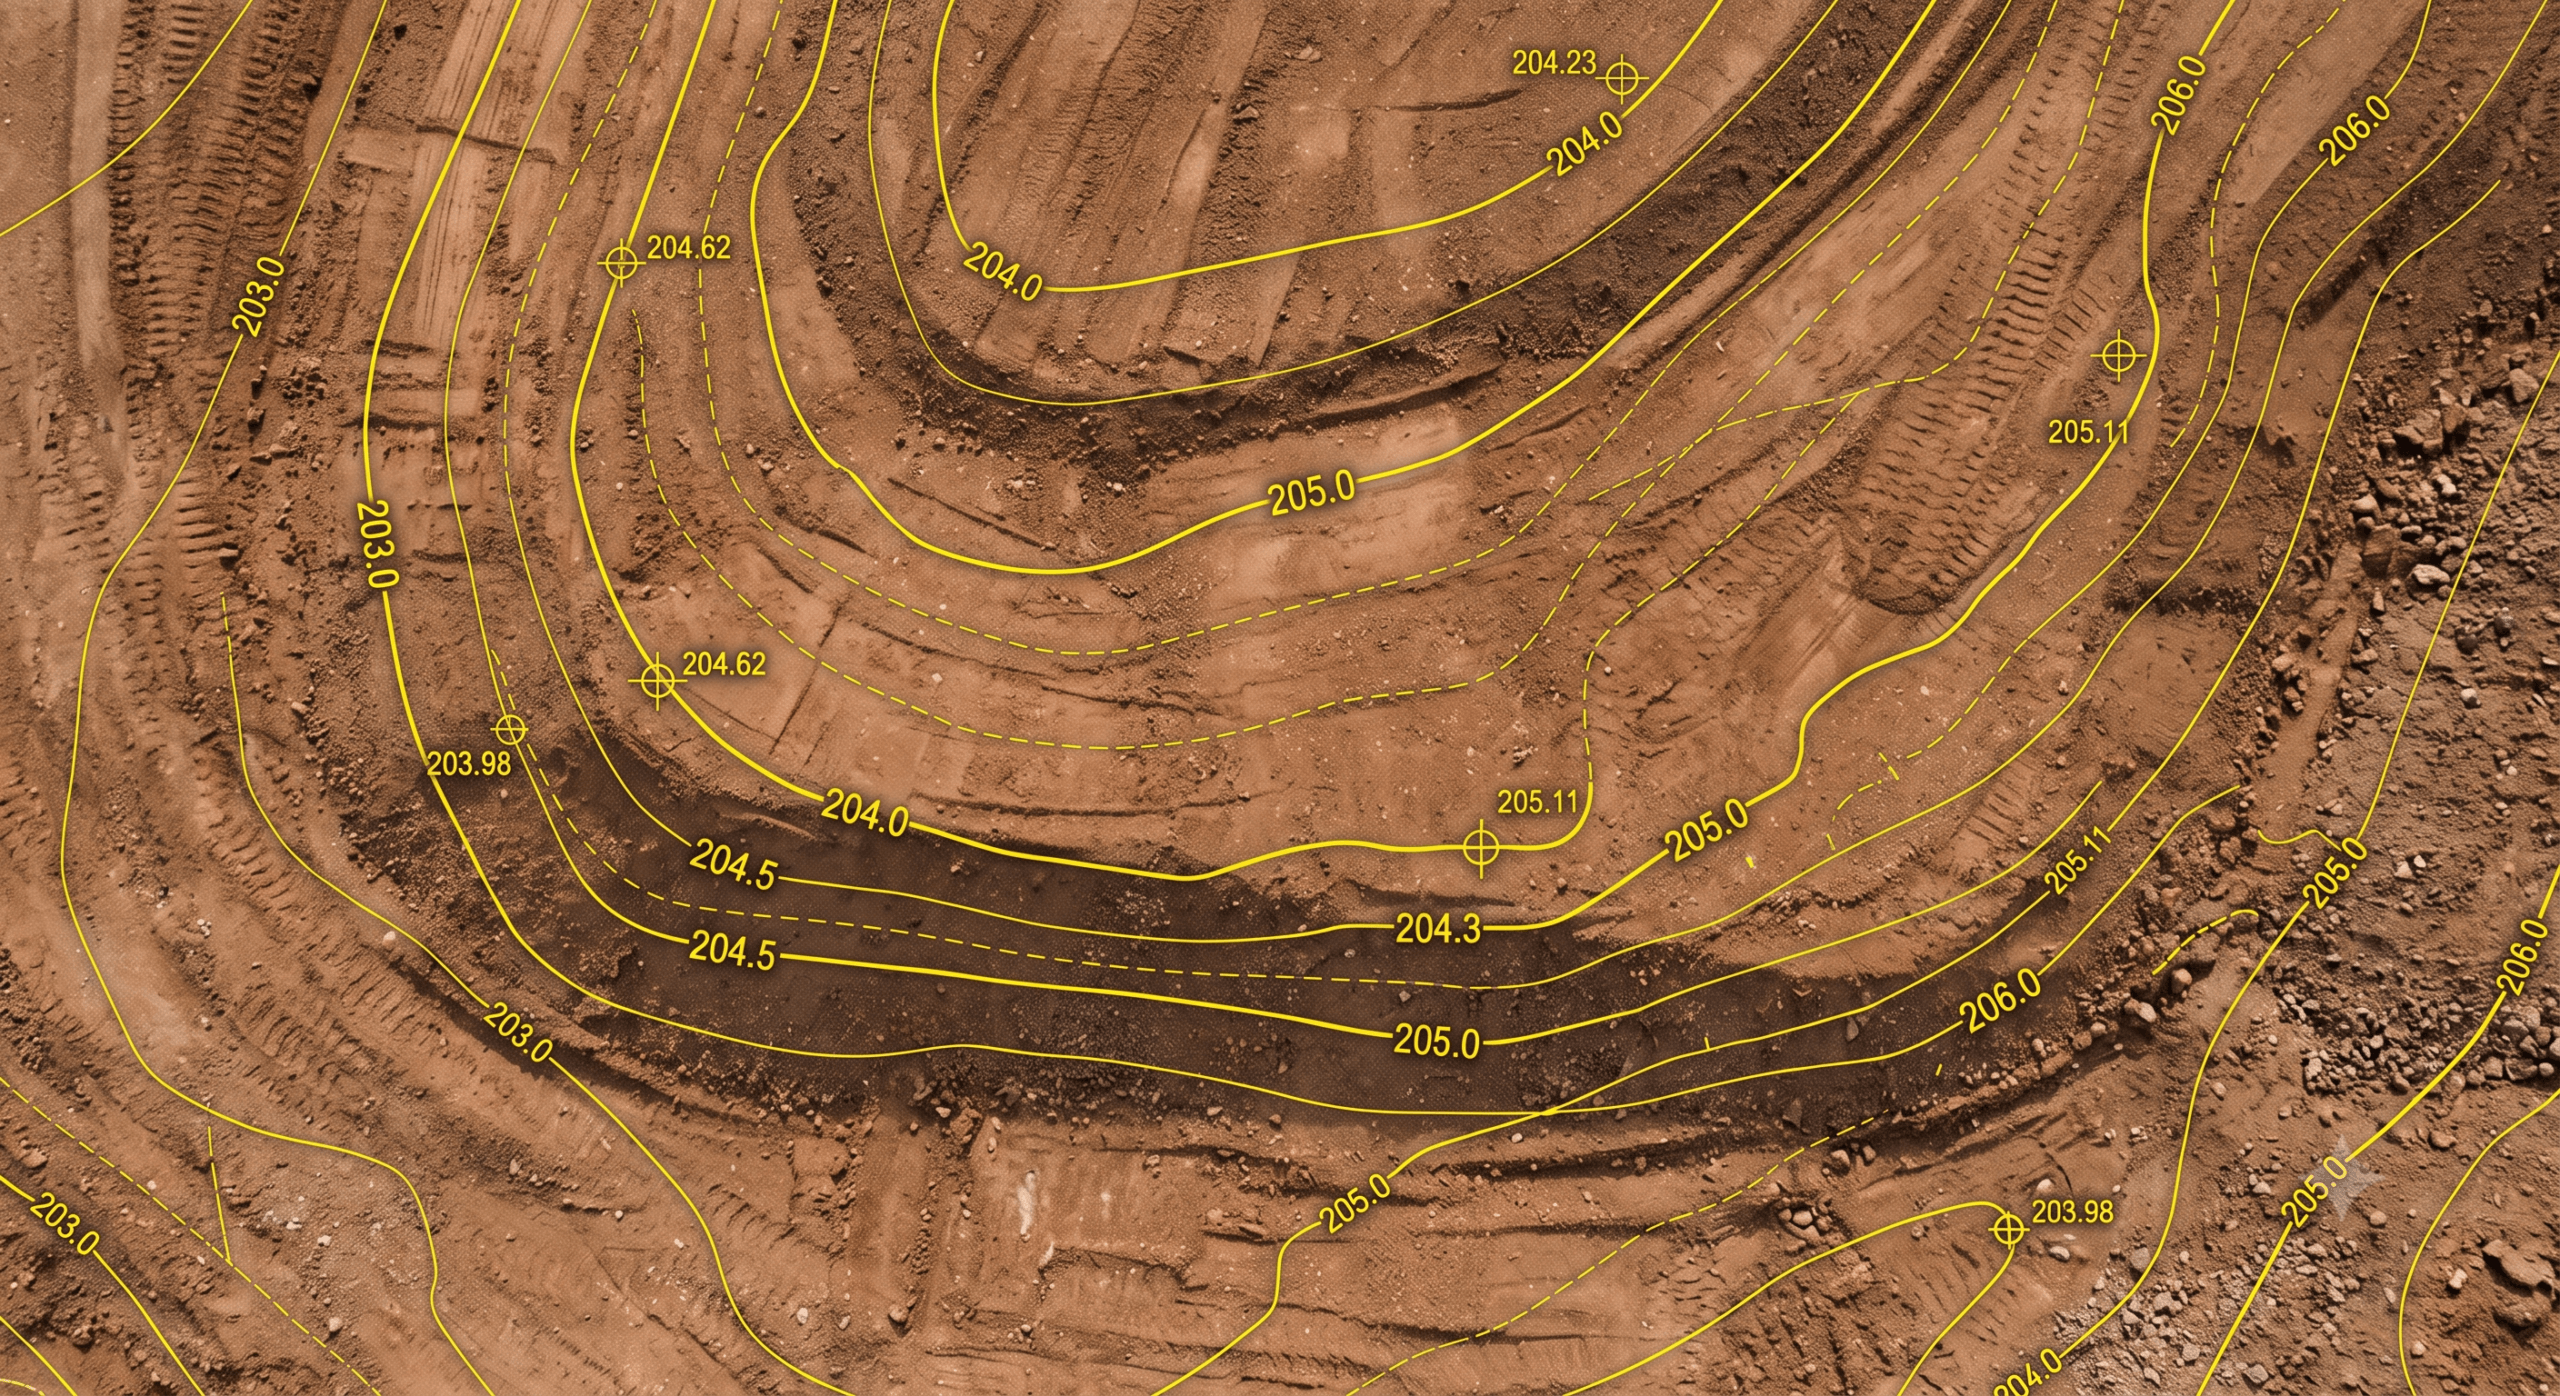
    Most conformance problems aren’t found too late because teams weren’t checking.

    They’re found too late because checks weren’t focused on the right things at the right time.

    A walk-around, a grade rod check in a few spots, a visual against the plans: none of that is a conformance check. It’s a spot-check. And spot-checks miss the things that matter most: grade drift across a large area, a section that’s running high before paving, drainage that looks fine visually but won’t drain the way the design intends.

    A proper conformance check is systematic. It covers the whole area, uses the approved design as the reference, produces a result you can share and defend, and generates a record for when someone asks later. It doesn’t need to be complicated, but it does need to be deliberate.

    This guide follows the walkthrough from the webinar From design to defensible: catching variance before it’s buried. The eight steps below are the same ones covered in the live platform demonstration. Follow them and you’ll have a conformance check result you can act on and stand behind.

    The process at a glance

    Your 8-step design conformance check

    01

    Align the coordinate system

    02

    Capture current site data

    03

    Upload the design files

    04

    Run cut/fill against the design

    05

    Check grade with cross-sections

    06

    Spot-check elevations in the field

    07

    Check drainage before paving

    08

    Export a timestamped report

    Step 1: Align the coordinate system

    Every design conformance check depends on the survey data and design files sharing the same coordinate reference system. If they’re not aligned, the comparison is meaningless — you’ll see apparent variance that isn’t there, or miss real variance because the offset is hiding it.

    In Propeller, this starts with the calibration file from your surveyor (Trimble JXL or CAL, Topcon GC3, or Leica LOK format). Drag it in when you create the site. It carries the projection, scale, and rotation that locks drone data and design files into the same spatial reference. If your designs are on a ground projection, the calibration file needs to include that definition.

    Before running any conformance check, confirm the calibration file is current and matches the coordinate system the design files were created in. If you’re seeing variance patterns that run consistently across the whole site rather than being localized to specific areas, coordinate misalignment is the first thing to check. The guide on false variance covers this in more detail, including the grid vs ground issue and the US survey foot vs international foot problem.

    Step 2: Capture current site data

    Use whatever capture method fits the site and the check. For a full-site conformance result, a drone or LiDAR survey gives you the most complete picture. For in-between checks on specific areas, DirtMate RTK lets field teams capture point checks and spot elevations without waiting for a full drone flight.

    If you have existing survey data — a TIN from a rover, a GeoTIFF DEM, a LAS or LAZ point cloud, or a CSV of points — you can upload that too. The comparison works on any surface Propeller can process, not just drone captures.

    One practical thing: if you’re running a conformance check before paving or before a critical handoff, run it with data that’s as current as possible. A survey from three weeks ago isn’t a conformance check on current site conditions. It’s a record of what the site looked like three weeks ago.

    Step 3: Upload the design files

    Open the designs tab and upload your files. Propeller supports DXF (from Trimble Business Center, Civil 3D, Carlson, and others), TTM, LandXML surfaces and alignments, IFC for 3D models like underground utilities, KML/KMZ, and PDF plan sheets. Because everything shares the site calibration, design data lines up with survey data without re-georeferencing.

    One thing to confirm before running the check: make sure the design file you’re uploading is the current issued-for-construction version. Design files get revised on most projects. If you’re comparing against an older revision, the variance result will reflect the difference between old and new design, not the difference between design and site conditions. Check the revision date against the current IFC drawing register before you upload. This is one of the most common causes of confusing conformance results. The false variance guide covers what to do if you’re not sure which version is current.

    Step 4: Run cut/fill against the design

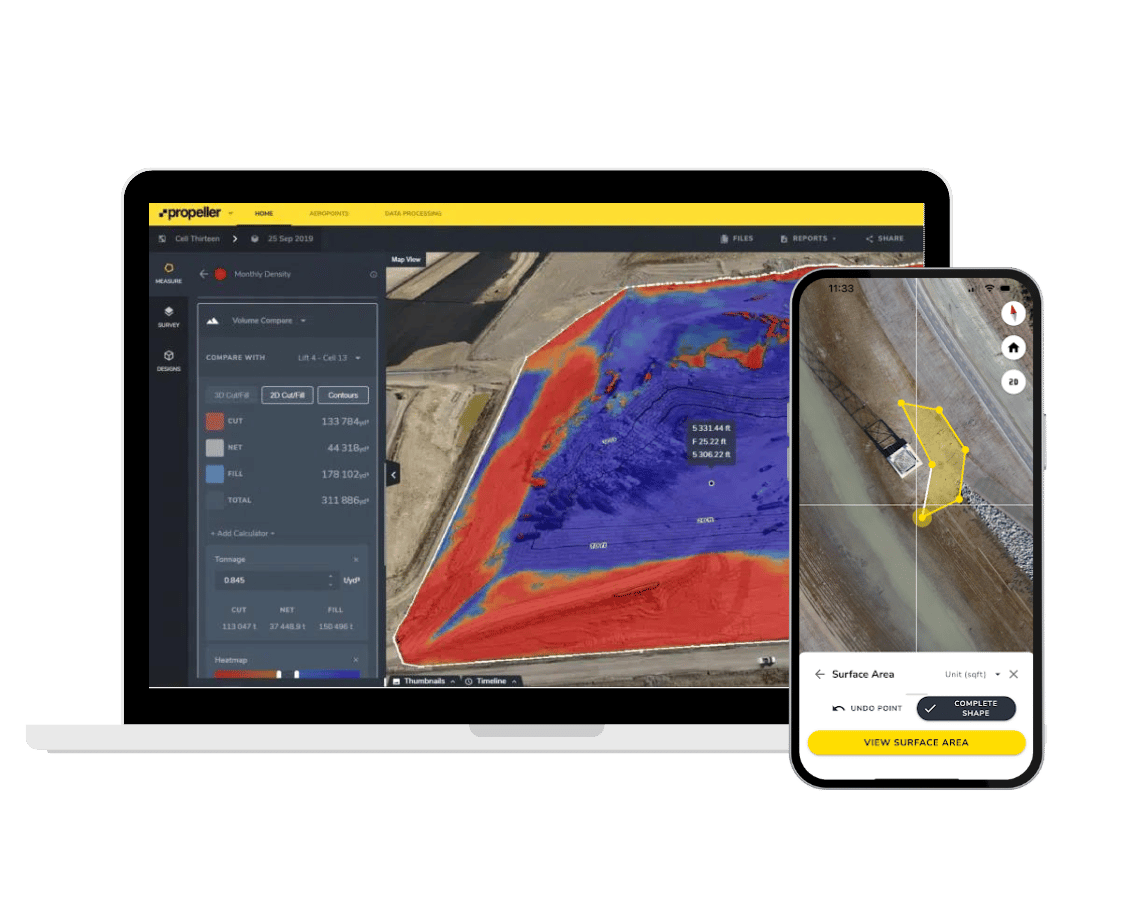
    Draw a boundary around the area you’re checking, or convert a design boundary into a measurement polygon, and run cut/fill against the active design surface. The heat map shows where the site is high, where it’s low, and where it’s on grade. Hovering over any point shows the elevation difference at that location. The panel shows net volume remaining and whether the area is a net cut or fill.

    Read the heat map for patterns, not just individual points. A small high area in the middle of an otherwise on-grade section is probably worth a field check. A consistent high pattern across a large area might be a coordinate or calibration issue: check that before sending a crew. A localized low section near a drainage feature is worth acting on quickly. What you’re looking for is what stands out against what you’d expect, and whether the pattern makes sense given the work that’s happened.

    The conformance workflow and the Grade Check tool give more context on how to interpret results for different site conditions.

    Reading the result

    Three heat map patterns and what they usually mean

    Consistent offset across the site

    Likely a coordinate or calibration issue. Check before sending a crew.

    Localised area, high or low

    More likely a real site condition. Warrants a field check or cross-section.

    Low near a drainage feature

    Act on this quickly. Worth a cross-section and a drainage check before the paver arrives.

    Step 5: Check grade with cross-sections

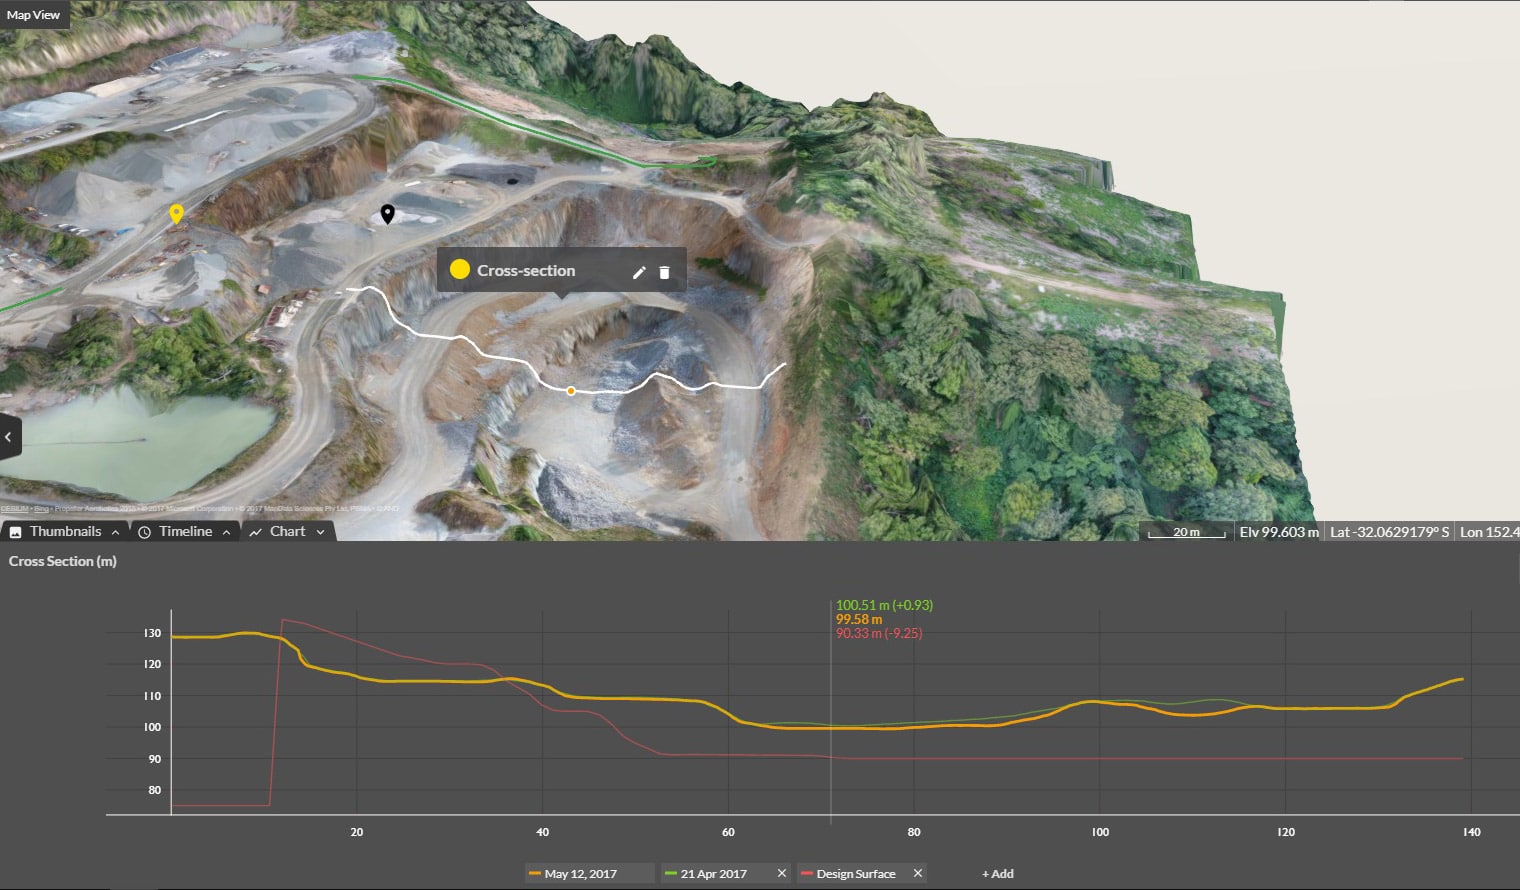
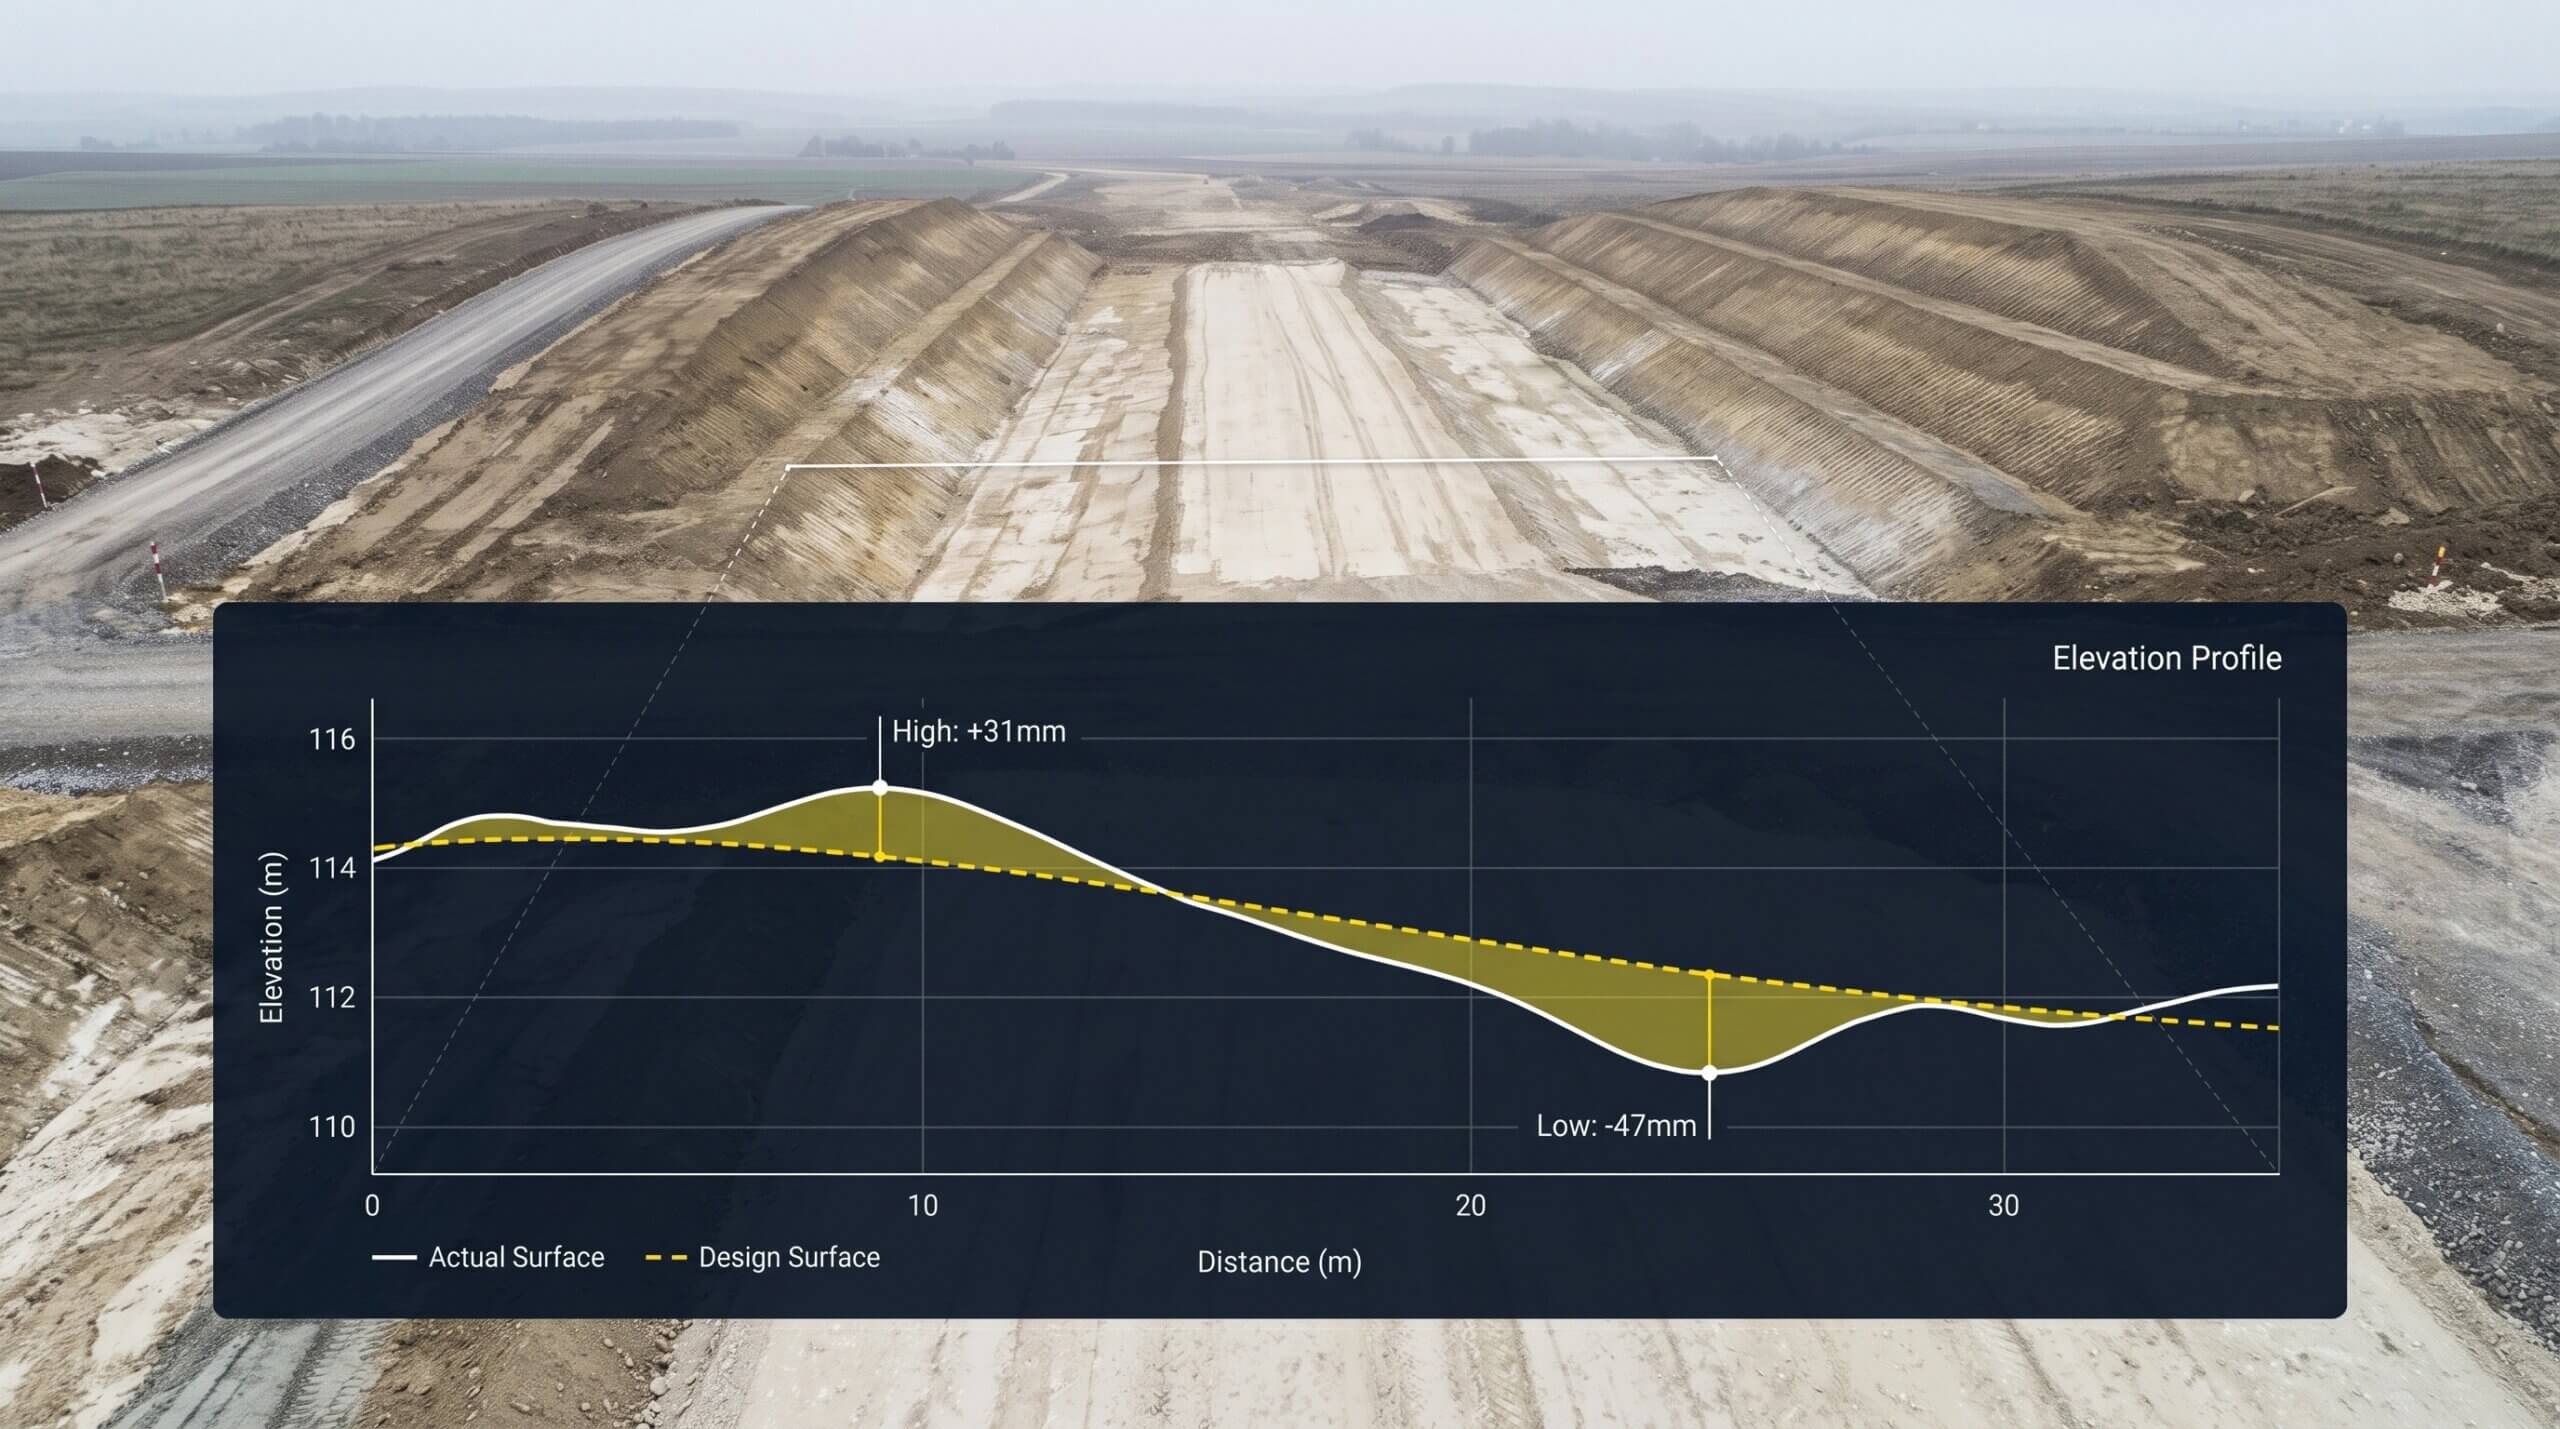
    Draw a line across the area you’re checking, or right-click a design centreline, to generate a cross-section. Add the design surface to compare it against the drone topo. Hover to see the vertical difference at any point, and exaggerate the vertical ratio to get a closer look at areas near grade.

    Cross-sections are particularly useful for roads, embankments, and drainage channels where the conformance story is really about the profile rather than the overall volume. A cut/fill heat map will show you the area is high by a certain volume. A cross-section shows you exactly where it’s high along the length of the road or embankment and how that profile compares to what the design specifies.

    This is also the tool that creates the most defensible closeout record. When a GC questions whether a subgrade was built to spec, a cross-section taken at the time of construction showing the surface compared to the design is a direct, visual, timestamped answer. One contractor using Propeller was facing a $400,000 rework dispute over slope construction. The GC claimed the work was out of compliance. The contractor pulled historical cross-sections, showed exactly what the slope looked like at completion, and resolved the dispute on the spot. (Proof details — confirm with Mel before external use.)

    Step 6: Spot-check elevations in the field

    The elevation difference tool lets you compare specific points against a design surface from the platform — similar to taking shots with a rover, but without leaving the office. In the field, DirtMate RTK connects to the Propeller mobile app so anyone on the crew can capture point checks — top of pipe before backfill, top and toe of curb, spot elevations at critical tie-in points — without waiting for a survey crew.

    Those points sync to the platform and sit in the same spatial reference as the drone survey and design data. They’re not a substitute for a full survey, but they’re a fast, practical way to verify critical points between flights and confirm the design comparison is telling the same story the field is seeing.

    This is especially useful in the window between drone surveys: you’ve had a flight, you’ve seen the conformance result, and you want to confirm a specific area is now on grade before moving to the next phase. DirtMate RTK gives you that confirmation without scheduling another full flight.

    Step 7: Check drainage before paving

    Grade can look right and still drain the wrong way. Propeller’s hydrology tools let you model drainage on the subgrade surface before it gets locked in under pavement — and they’re significantly faster than doing this manually.

    Liquid drop analysis shows which way water flows across any point on the surface. Catchment and watershed analysis identifies the area draining to a selected outflow point, such as a culvert, so you can sanity-check pipe sizing and structure placement against the drainage design.

    These tools model the surface only. They don’t account for soil absorption or subsurface conditions, so treat the results as an early-warning layer rather than a final engineering determination. But for catching a subgrade that drains toward the wrong outfall, or identifying a low spot that will pond before the asphalt crew arrives, they’re fast and practical. Running a drainage check at this stage costs nothing compared to dealing with a ponding problem after the road is paved.

    Step 8: Export a timestamped conformance report

    With your measurements on, open the outputs tab and generate a report. Frame the view, select your measurements, and export. The PDF includes the survey date, coordinate system, report date, and who generated it, along with the overview map, spot elevations, cross-sections, and cut/fill results.

    This report is what makes the work defensible. Share it with a GC before a pay app, send it to a sub to direct their next shift, or keep it as part of your phase closeout record. It answers the question “was this area built to design?” in a format that anyone on the project can read, tied to a specific date and a specific survey.

    The timestamped report is also what makes future disputes manageable. When questions arise later (about what the site looked like before handoff, whether a specific area was compliant at the time of paving, or what the grade was before another trade moved in), you have the record. You don’t need to reconstruct anything. You pull up the report, share it, and move on.

    Learn more about what reporting looks like across the full design conformance and as-built workflow, and how teams use it for pay app support, owner updates, and regulatory closeout.

    What this looks like when it matters: the retention pond that didn’t need defending

    One excavation contractor built a retention pond in compacted lifts. After heavy rain eroded part of the freeboard, the GC questioned whether the lifts had been placed as specified. The conversation had every ingredient of a difficult dispute: physical evidence of change, no obvious record, and a contractor who knew the work was done right but couldn’t immediately prove it.

    Because the contractor had surveyed weekly throughout the build, they could pull up cross-sections from each survey capture. The data showed every lift, placed roughly every 1.5 to 2 feet, from start to finish. The GC could see the full lift history, the grade at each stage, and the progression from initial excavation to finished pond. There was nothing to dispute. The work was documented. The conversation was over before it started.

    Without that record, the contractor could have been asked to redo the work at their own cost. With it, they had the history, the timestamps, and the cross-sections. That’s the practical difference between a regular conformance workflow and a one-off closeout check. (Story based on contractor experience — confirm details with Mel before external publication.)

    Watch the full walkthrough on demand

    Watch on demand: See every one of these steps live in From design to defensible, including the calibration walkthrough, the in-cab DirtMate view, the hydrology checks, and the full Q&A. Free to watch any time.


    Wondering where your team’s conformance workflow has gaps? Take the readiness quiz for a quick picture of where to focus first.

    Frequently asked questions

    Align your survey and design to the same coordinate system, upload the approved design files, run a cut/fill comparison to see where the site is above or below design, check grade with cross-sections at key locations, spot-check critical elevations in the field, verify drainage with hydrology tools before paving, and export a timestamped report. The eight steps above cover each one in detail.

    Yes. With DirtMate RTK and the Propeller mobile app, operators see the machine’s current elevation, the design elevation, and the cut/fill difference as they move. It works on rental or older equipment without machine control, and also works from a supervisor’s truck. You can also set a fixed elevation reference where there’s no design, such as in a quarry.

    Yes. Upload an existing surface — a TIN, GeoTIFF DEM, or LAS/LAZ point cloud — alongside your design and run the comparison from the existing data. You can also upload a CSV of points to check specific elevations against the design.

    DirtMate RTK lets field teams capture point checks and spot elevations between flights. For specific areas like trenches or tight spaces, Handheld Scanning can capture a 3D surface as a point cloud. Both sync to the platform and sit in the same reference as your drone survey data.

    DXF, TTM, LandXML (surfaces and alignments), IFC, KML/KMZ, and PDF plan sheets. Most standard civil design formats are supported. See the full workflow page for more detail on how design files work in Propeller.

    Comparing two surveys shows you what changed on site between capture dates. Comparing a survey to a design shows you whether what was built matches the approved plan. Both are useful, but only the second one answers the conformance question. Why design variance found late costs more covers the context for why this distinction matters.

    Quick links

      Related articles

      Graded earth surface with a cut/fill design overlay of contour lines and grade markers

      Data center site prep and the true cost of grading delays

      Data center construction delays are expensive because facilities run on a power-on date, and a…
      Propeller Mobile: Site Maps in Field

      No matter which area of earthworks or civil construction you work in, we understand that…

      Why construction data analytics teams need drone mapping

      Construction projects generate more data than ever, but data alone does not move a job…

      Ready to learn how Propeller can power up your worksite?

      We’re happy to show you how Propeller can power your worksite, and boost productivity.

      Related articles

      Cross section survey in a matter of minutes using drone data

      With the power of drone-captured data and the Propeller Platform, surveying cross sections becomes as…

      AeroPoints Help NOAR Technologies Bring Accurate Ground Control to AEC

      NOAR Technologies is an AEC (architectural, engineering, and construction) tech solutions provider from Detroit, Michigan.…

      A Surveyor’s Guide to Drones: Selecting the Drone, Camera, and Licenses (Part 1)

      Part One—Hardware Since the invention of the total station in the early ’70s and the…