When stockpile numbers don’t reconcile: 15 questions to work through

Read Time: 11 mins
Quick links
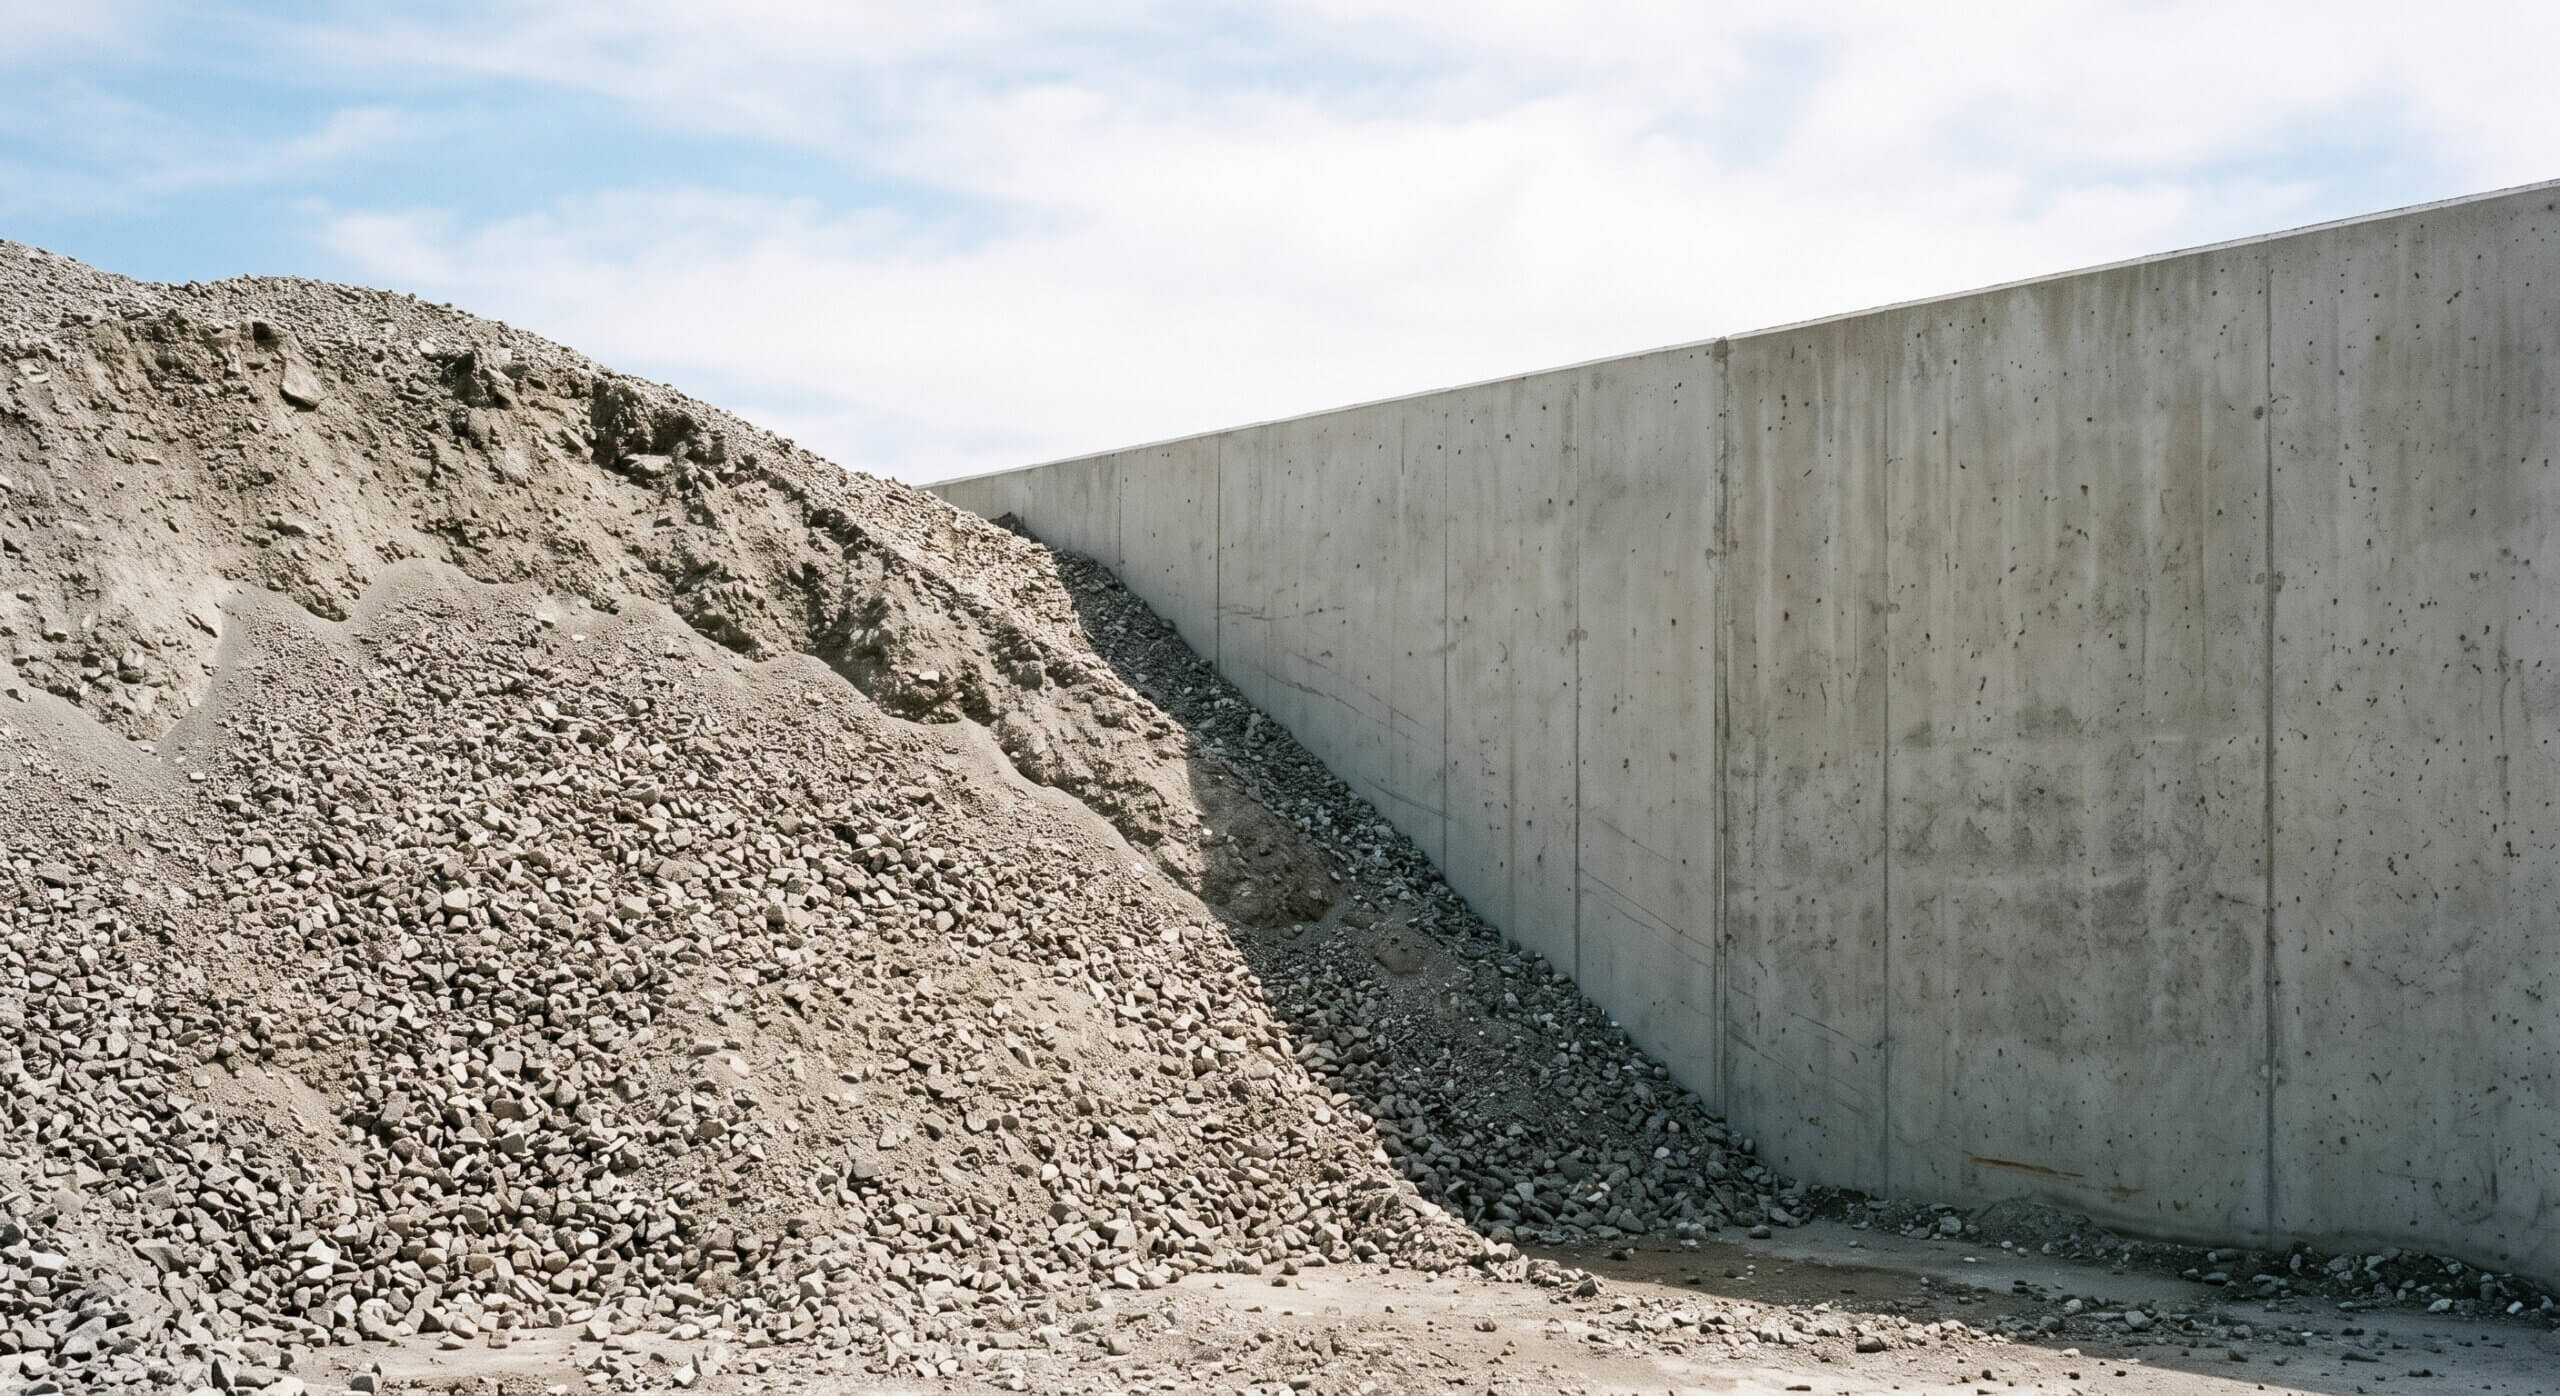
    Corner of a crushed-aggregate stockpile against a clean concrete retaining wall in daylight

    Stockpile reconciliation depends on accurate measurement, consistent density, connected reporting, and a documented audit trail. These 15 answers cover how to get each one right, from how drone volumes compare to manual methods through what evidence to keep every reporting period.
    A strong reconciliation process makes your stockpile numbers easy to trace, explain, and reproduce from one period to the next. It rests on four things: consistent measurement, documented density, source records anyone can follow, and one shared process across teams. These FAQs work through the practical questions behind each one. They run from drone accuracy and density to reporting, audit trails, survey cadence, and the standoff that happens when operations and finance land on different numbers. Most of it applies across aggregates and mining operations alike.

    The 15 questions
    1How accurate are drone stockpile volumes, really?
    2What breaks accuracy fastest?
    3How do you avoid boundary noise between surveys?
    4How do you handle vertical faces and piles against rock walls?
    5Where should density come from, and how often should it change?
    6What is the risk of using a standard density?
    7How do you explain density to finance or audit?
    8What should a defensible stockpile report include?
    9Can reports be exported and still be defensible?
    10How do you keep numbers connected to their source?
    11What is an audit trail for stockpiles?
    12What evidence should be kept each reporting period?
    13How do you make reconciliation repeatable across sites and teams?
    14How often should we survey? What cadence is enough?
    15What do you do when operations and finance disagree?

    Measurement FAQs

    Accuracy questions come first, because every downstream number inherits them. These four cover what drone volumes can and cannot promise.

    Short answer: PPK-corrected drone photogrammetry typically delivers volume accuracy within 1–3% of actual stockpile volume under standard conditions, with positional accuracy of approximately 3 centimeters for the terrain model.

    Why it matters: Volume accuracy is a function of both positional accuracy (how faithfully the 3D model represents the pile surface) and methodological consistency (whether the same boundary and base surface rules were applied as the previous survey). A highly accurate terrain model sitting on an incorrectly defined base surface will still produce an incorrect volume.

    What to do: Treat positional accuracy as a starting point and confirm the methodology holds alongside it. Verify your capture method (PPK correction confirmed, ground control or a checkpoint used), then confirm boundary and base surface definitions are consistent with prior surveys.

    What to document: Capture method and correction type, checkpoint results confirming accuracy, volume calculation method per pile, and a boundary snapshot.

    Short answer: Inconsistent methodology between surveys, not hardware, is the most common source of large, unexplained variance.

    Why it happens: Boundary drift, base surface changes, and density updates between surveys quietly compound into large discrepancies that look like measurement error but are really methodology noise. A polygon that shifts by a few meters at the toe will include or exclude a meaningful slice of material. A base method change from smart base to custom base on a sloped pad can shift the reported volume by 5–15% with no change to the actual pile.

    What to do: Lock methodology at the stockpile level. Each pile should have a documented volume method, boundary rule, and base surface definition enforced across every survey, regardless of who processes it. Any change should be deliberate, documented, and its effect on the comparison quantified before reporting.

    What to document: Method per pile (logged in the platform where possible), any methodological changes and the reason, and the estimated volume impact of any change.

    Short answer: Review and confirm the polygon boundary against the physical pile extent on every survey before calculating a volume.

    Why it happens: Piles grow, shrink, spread, and merge. A boundary that was correct six weeks ago may not reflect the current toe line, especially for crushed rock or blended aggregate that spreads over time. If the boundary does not track the actual pile, every volume delta carries boundary noise on top of real material movement.

    What to do: Make boundary review a step in the survey processing workflow, not a one-time setup task. Compare the current boundary against the terrain model to confirm the toe line is captured. For merged or adjacent piles, check that each boundary is still distinct. Update boundaries to match reality and note the update in the processing record.

    What to document: A boundary snapshot from each survey, and any boundary updates with the operational reason (pile spread, material addition, consolidation).

    Short answer: Use a custom base surface and make sure the boundary captures the full extent of the pile, including any overhanging material the drone can see.

    Why it matters: Piles against rock walls or vertical cuts have complex base geometry. An assumed flat base or a smart base algorithm will typically overestimate volume because it cannot see the wall face or correctly interpolate the ground beneath the pile’s back edge.

    What to do: Capture a reference survey of the wall or vertical face before the pile is built, or use a design surface as the base. For existing piles, a best-estimate custom base from survey context beats a flat reference level. If the wall geometry is inaccessible to the drone, note the limitation and the assumed base in the measurement record.

    What to document: Base surface method, any assumptions about inaccessible geometry, and a comparison of custom base against reference level to quantify the methodological difference.

    Density FAQs

    Density is the quietest source of variance and the hardest to argue about after the fact. These three keep it defensible.

    Short answer: Density should come from lab-tested or site-measured bulk density values for each material type, validated at least quarterly, and stored in the measurement platform rather than a downstream spreadsheet.

    Why it matters: Published bulking factors (roughly 1.12 for sand and gravel, around 1.50 for blasted hard rock) are useful starting points but carry a wide error range. A site that uses a generic factor for a well-graded sandy gravel with a measured swell of 1.08 is systematically over-reporting tonnage every period.

    What to do: Establish baseline density figures from lab testing for each material type. Review them quarterly, or when material characteristics change (seasonal moisture shifts, a new product grade, a changed blasting pattern). When you update a figure, note the change and the reason, and carry both the old and new figure through the current period so the change is visible rather than absorbed into unexplained variance.

    What to document: Density figure per material, source (lab test, site measurement, or industry reference), date last validated, and any changes with the reason for each.

    Short answer: A standard or generic density that does not match your actual material introduces a systematic error into every volume-to-tonnage conversion, and that error shows up as unexplained variance every reporting period.

    Why it happens: Industry references for bulk density are averaged across material types, moisture conditions, and processing states. Your crushed basalt in a wet winter is not the reference crushed basalt in the table. The gap is small enough to go unnoticed in any single period but accumulates over quarters into a variance that no amount of boundary checking will explain.

    What to do: Even a rough site-based validation, such as weighing a known volume of material on a certified scale, beats a published table. If lab testing is not practical for every material type, validate your most common and highest-volume products first. Use the validated figure in the platform and document the validation date.

    What to document: Which materials use lab-validated density versus industry references, when each was last validated, and the uncertainty range accepted for each.

    Short answer: Present density as a documented, validated input rather than a variable, and show that it is stored with the measurement instead of applied separately.

    Why it matters: Finance teams and auditors are not asking whether the density is right. They are asking whether it is consistent, traceable, and defensible. A density figure they can trace to a lab test and see applied consistently across 12 months of reports is defensible even if it is not perfectly precise. A density that varies period to period without documentation is indefensible even if it happens to be accurate.

    What to do: Produce a density register: a simple table showing each material type, the figure currently in use, the source (lab test or validated reference), and the date last reviewed. Share it alongside the reconciliation report so reviewers can see the inputs, not just the output.

    What to document: The density register (material, figure, source, last review date), any period-on-period changes and the reason, and a measurement report showing density embedded in the calculation rather than appended.

    Reporting FAQs

    A number is only as good as the report it travels in. These three cover what a defensible report holds and how to keep it connected to its source.

    Short answer: A defensible report includes the survey details, the methodology applied, the conversion assumptions, the comparison figures with sources, and a plain-English explanation of any variance.

    The full list:

    • Survey date and capture method
    • Volume calculation method per pile
    • Boundary and base surface definition (with snapshot or export)
    • Density and swell or shrinkage factors, with source and last validation date
    • Reporting period and cutoffs
    • Book inventory figures with source system and export date
    • Reconciliation comparison (surveyed vs. expected, in consistent units)
    • Variance per pile and total
    • Delta explanation (cause, estimated impact, action, and owner)

    What to document: The report itself is the documentation. Generate it from the platform’s reporting tools where possible, so the volume figure traces back to the survey rather than existing as a standalone cell.

    Short answer: Yes, if the export carries the provenance of the measurement, not just the number.

    Why it matters: A PDF or CSV export from the platform is defensible because it carries the survey context, methodology, and volume figure together. A number copied from a platform report into a spreadsheet and reformatted is not defensible, because the link to the source survey breaks the moment the copy is made.

    What to do: Use the platform’s native report export (PDF or CSV). A Propeller Measurement Report, for example, carries the pile image, volume, tonnage, and material together and traces directly back to the survey it came from. If extra formatting is needed for internal reporting, keep the platform export as the source document and reference it rather than replacing it.

    What to document: The platform export is the primary document. Reference it in any downstream report by survey date and platform report ID.

    Short answer: Keep all stakeholders working from the shared measurement platform, not from copies of exported data.

    Why it happens: The most common break in the provenance chain is the spreadsheet handoff. Once a volume leaves the platform as a cell value, it is disconnected from its source. Finance, operations, and site managers who need stockpile data should reach it through the shared platform, where they can verify the methodology, trace the number back to its survey, and see the pile in spatial context.

    What to do: Set up user access in the platform for the stakeholders who need stockpile data regularly, so the team can work from one shared record. For reporting periods, generate and distribute the platform’s native report rather than copying numbers into a shared spreadsheet. For stakeholders who need the number in a system of record (ERP, finance platform), use the platform export as the source and automate the transfer where possible.

    What to document: Which stakeholders have platform access and at what permission level, and how data is transferred to downstream systems.

    Audit trail FAQs

    An audit trail is what lets someone else reach your number without you in the room. These three define it and what to keep.

    Short answer: An audit trail is the documented chain of evidence that lets someone who was not present re-run your reconciliation from scratch and reach the same conclusion.

    What it includes:

    • The survey record (date, method, platform export)
    • The methodology applied (volume method, boundary rules, base surface definition)
    • The density and conversion inputs (figures, sources, validation dates)
    • The book figures used (source system, export date)
    • The reconciliation comparison (a structured calculation, not a formula with hidden cell references)
    • The delta explanation (cause, impact, action, owner)

    The test: Give the package to a colleague who was not involved in producing it. If they cannot re-run the reconciliation and reach the same conclusion without calling you, it is not yet a complete audit trail.

    What to document: All of the above, retained in a consistent location per period (a folder in the platform, a shared drive with version control, or a document management system).

    Short answer: At minimum, keep the survey export, the methodology snapshot, the density register, the book figures with timestamps, and the delta explanation.

    For operations with royalty obligations, JV partners, or external audit requirements, set the bar higher: retain everything needed to reproduce any period’s reconciliation from the documentation alone, for at least 24 months.

    Retention checklist per period:

    • Platform survey export or PDF report (date, method, volume per pile)
    • Boundary snapshot per pile
    • Base surface definition per pile
    • Density register (material, figure, source, validation date)
    • Book figures (opening balance, production, sales, rehandles, waste, with source and export date)
    • Reconciliation comparison table
    • Delta explanation narrative
    • Action log (owner, due date, status at next review)

    Short answer: Standardize methodology at the stockpile level, share it in writing, and enforce it as an operational control rather than a best practice.

    Why it fails without standardization: When different operators apply different boundary rules, base methods, or density assumptions to the same pile across surveys, the reconciliation measures methodology variation as much as material movement. Variance that should be traceable becomes structurally unexplainable.

    What to do:

    • Document a method card per pile (volume method, boundary rules, base surface definition, density figure, review frequency)
    • Store density and conversion factors in the platform, not in individual operator spreadsheets
    • Make methodology review part of onboarding for any new site or team member, the same way a survey or engineering team inducts a new hire
    • Schedule a methodology audit annually, or when a site shows persistent unexplained variance

    What to document: A method card per pile (stored in the platform or a shared document), and any deviations from the standard method with the reason.

    Implementation and workflow FAQs

    The last two are about making reconciliation stick: how often to survey, and what to do when two teams land on different numbers. That second one usually comes down to one thing: operations and finance measure the pile in different ways.

    Operations works from
    Surveyed volume, with density and swell applied to reach tonnage. A physical snapshot of the pile on the survey date.
    Finance works from
    Production records, sales dispatches, and ERP inventory. A running ledger across the full reporting period.

    Both can be internally right and still disagree. Align the inputs, and the outputs follow.

    Short answer: For continuous-production operations, monthly is the minimum that makes reconciliation useful. Every two weeks is where reconciliation becomes proactive rather than reactive.

    Why cadence matters: The longer the gap between surveys, the more production and sales accumulate against a snapshot that may no longer reflect the pile. A variance found at year-end after two annual surveys has no traceable cause, because the operational context is gone. A variance found three weeks after a survey can usually be traced to a specific dispatch, a rehandle, or a density assumption while the people who know what happened are still on the job site.

    How to choose cadence by operation type:

    • High-throughput quarry (daily production): every two weeks minimum; weekly is defensible for high-value piles or royalty-reporting sites
    • Lower-throughput operation: monthly is enough if production volume is low and methodology is tightly locked
    • Multi-site operations: synchronize survey schedules across sites so reconciliation reports consistently at the portfolio level, tied to your progress tracking cadence

    What to document: Agreed survey cadence per site and per pile type, and a deviation log when surveys are missed or delayed, with the reason.

    Short answer: Go to the inputs, not the outputs. Disagreements about the stockpile number almost always trace to a difference in methodology, density assumption, or timing rather than a fundamental error in either team’s figures.

    Why it happens: Operations typically works from surveyed volume and applies density and swell to get tonnage. Finance typically works from production records, sales dispatches, and ERP inventory. Both can be internally consistent and externally mismatched, because they are measuring different things across slightly different periods with different conversion assumptions.

    What to do:

    1. Agree on the period being compared before discussing the numbers
    2. Compare the density and swell figures used on each side
    3. Check the cutoff dates for sales and dispatch on the book side against the survey date on the field side, cross-referencing machine telematics where cycle counts can confirm movements
    4. Identify which system each team’s opening balance came from and confirm they share the same starting point
    5. If a difference persists after all inputs are aligned, treat it as a residual variance to investigate and document, rather than a disagreement to settle by negotiation

    What to document: The agreed methodology for the comparison (which density, which cutoffs, which opening balance), the figures each side produced using it, and the residual variance with its explanation.

    Resources

    Watch on demand: From measured to defensible: how to reconcile stockpiles with confidence, the webinar recording.

    Download the playbook: The Defensible Stockpile: a reconciliation playbook for aggregates operators, a gated asset with the full template set.

    Explore volume calculations: see how stockpile measurement and volume calculations work in the platform.

    Book a demo: request a demo to walk through reconciliation on your own piles.

    Quick links

      Related articles

      How to Survey Worksites with Significant Elevation Change

      To survey a site with significant elevation change you will need to fly two different…

      3 Tips to Manage Change Orders (and Save Your Business Money)

      According to the Independent Project Analysis Group, an average of 35% of all construction projects…
      Dirtmate product trails

      Keep projects moving with daily production KPIs

      Staying on schedule and on budget takes more than hard work—it takes data. Lots of…

      Ready to learn how Propeller can power up your worksite?

      We’re happy to show you how Propeller can power your worksite, and boost productivity.

      Related articles

      Drone pilot in hi-vis flying a drone next to a crane, with an AeroPoint on the floor.

      Things To Know About Ground Control in Drone Surveying

      Ground control is the go-to option for turning drone data into highly accurate, survey-grade models.…
      DJI M4E flying in the sky

      Propeller’s Drone Guide: DJI Solutions for Commercial Operations

      At Propeller we love testing new drone hardware and we are processing hundreds of drone…

      Telecom Tower Inspection using DJI Phantom 4 Pro: Step-by-Step Guide

      A few weeks ago a new DJI Phantom 4 Pro was delivered to our office.…