What is the Timeline tool in the Propeller Platform?
With the Timeline tool, you can chronologically navigate through your drone-generated worksite surveys so you can track earthwork over time.In the Propeller Platform, you can take measurements of a feature on your site (such as the elevation of a surface or the volume of a stockpile) and then use the Timeline tool to calculate the changes to that feature between survey dates.
As worksites continue to become more digitized, it’s become clear that the future of construction and other industries that deal in earthwork is data. Lots and lots of data.
Organizations that have invested in consistent data-gathering and analysis workflows have an advantage over competitors who lack the same. With greater insights into their worksites, these organizations are able to plan project logistics further in advance, track progress with the goal of streamlining operations, and catch errors and miswork before they turn into costly disputes.

For earthwork projects, that data comes in the form of topographical surveys, and, today, the best way to get more site topos is drones. Flying your site is significantly faster, more affordable, and just as accurate as traditional, ground-based surveying methods. In short, drones = more frequent topo data.
But all these topos mean nothing without a straightforward, seamless way to turn them into actionable insights. The Propeller Platform’s Timeline feature is a simple tool that allows you to quickly compare all your surveys in a convenient, visually engaging format.
How to use Propeller’s Timeline tool to track earthwork progress
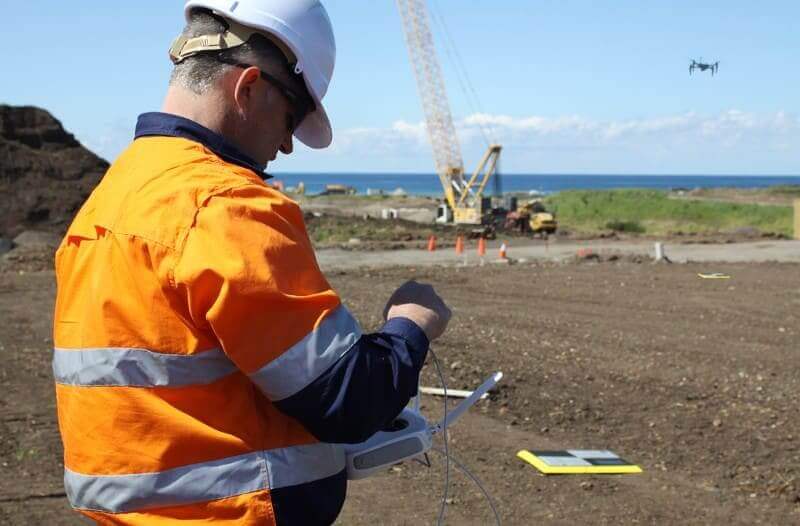
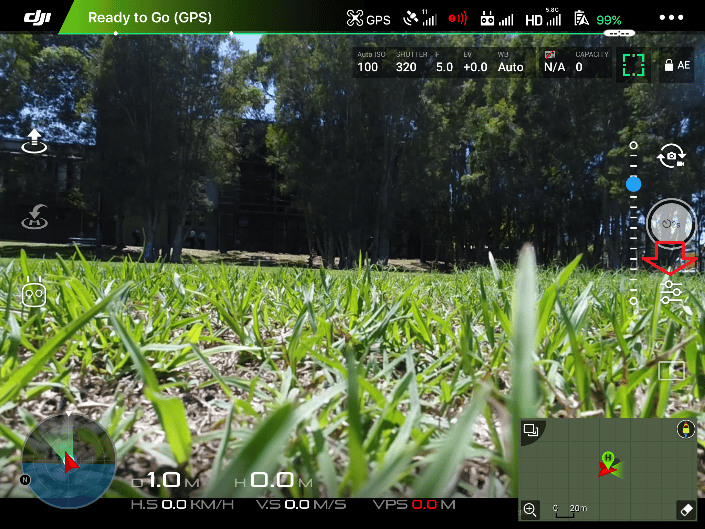
After you fly your site and upload your drone images and ground control data to the Propeller Platform, we process them into interactive visual outputs that you can analyze. Unlike lidar and other surveying techniques, drone photogrammetry is able to generate photorealistic 3D models of the land it captures.

How you choose to view your site depends on what your goal is. If, for instance, you want to check the progress of a road development project, you can choose to view only the orthophoto. An orthophoto is an aerial, 2D snapshot of your site that’s been stitched together from all the images you drone took. If you just want to need to track changes in horizontal distance, orthophotos will do.
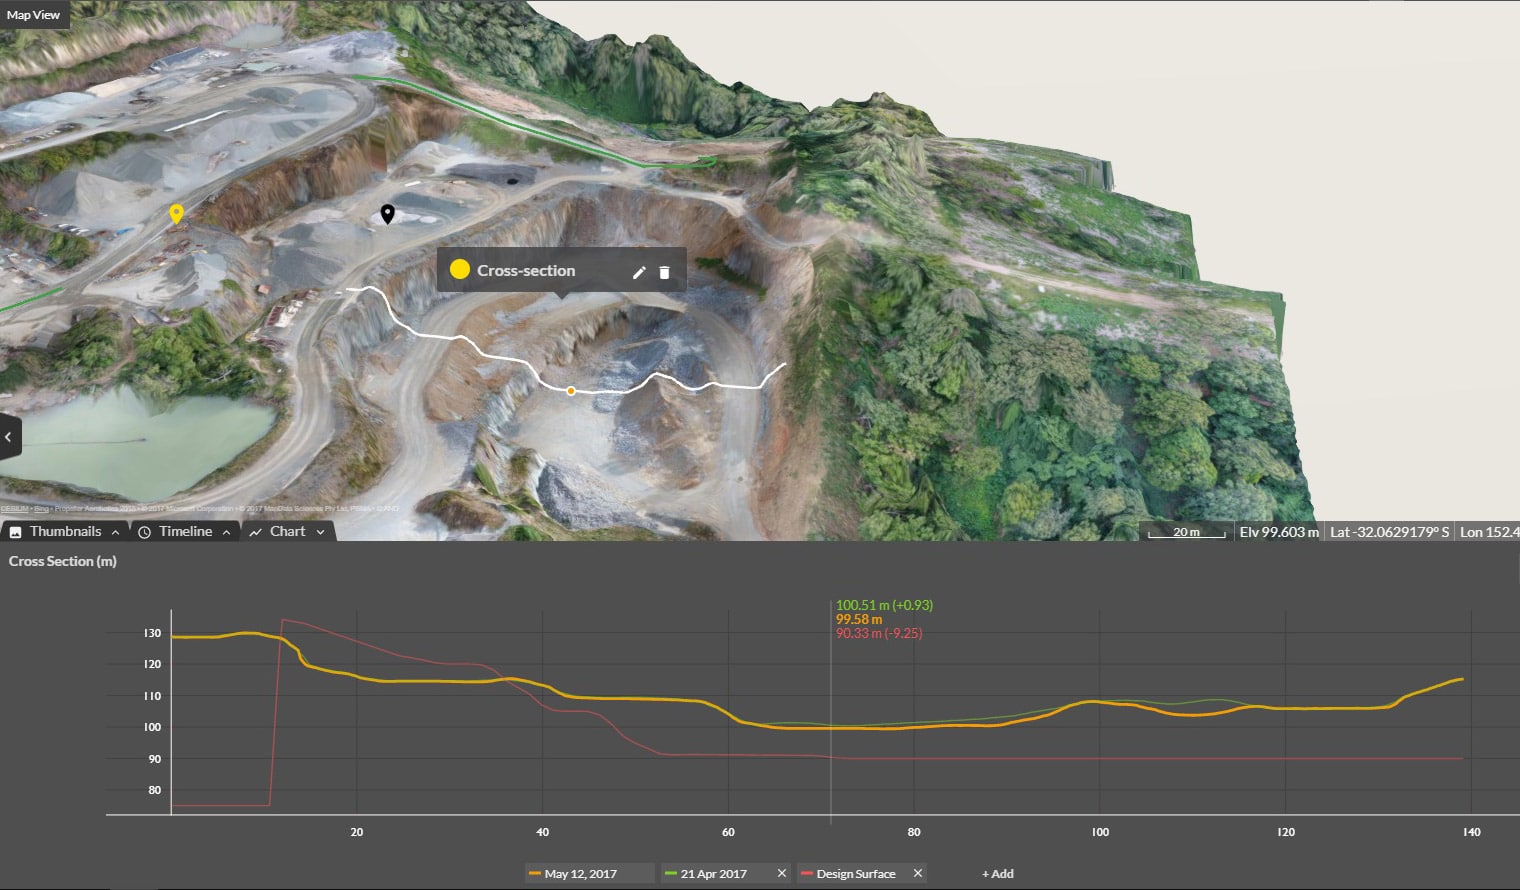
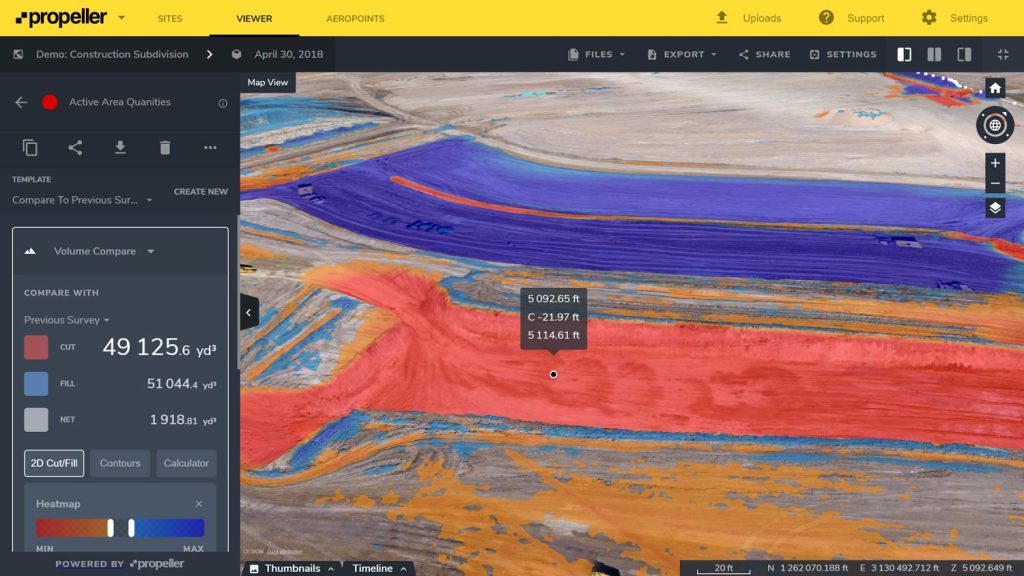
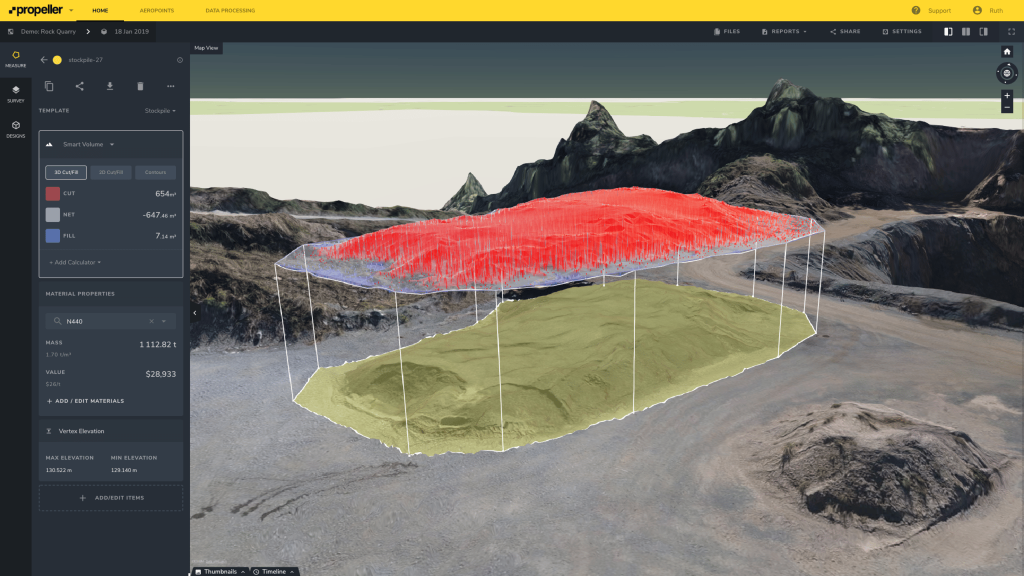
But if you want to determine the volume of a stockpile, generate a cut/fill map, compare your existing surface to final design grade, or do anything else that requires measurements in three dimensions, you’ll need to turn on your elevation data, creating a 3D model of your site.
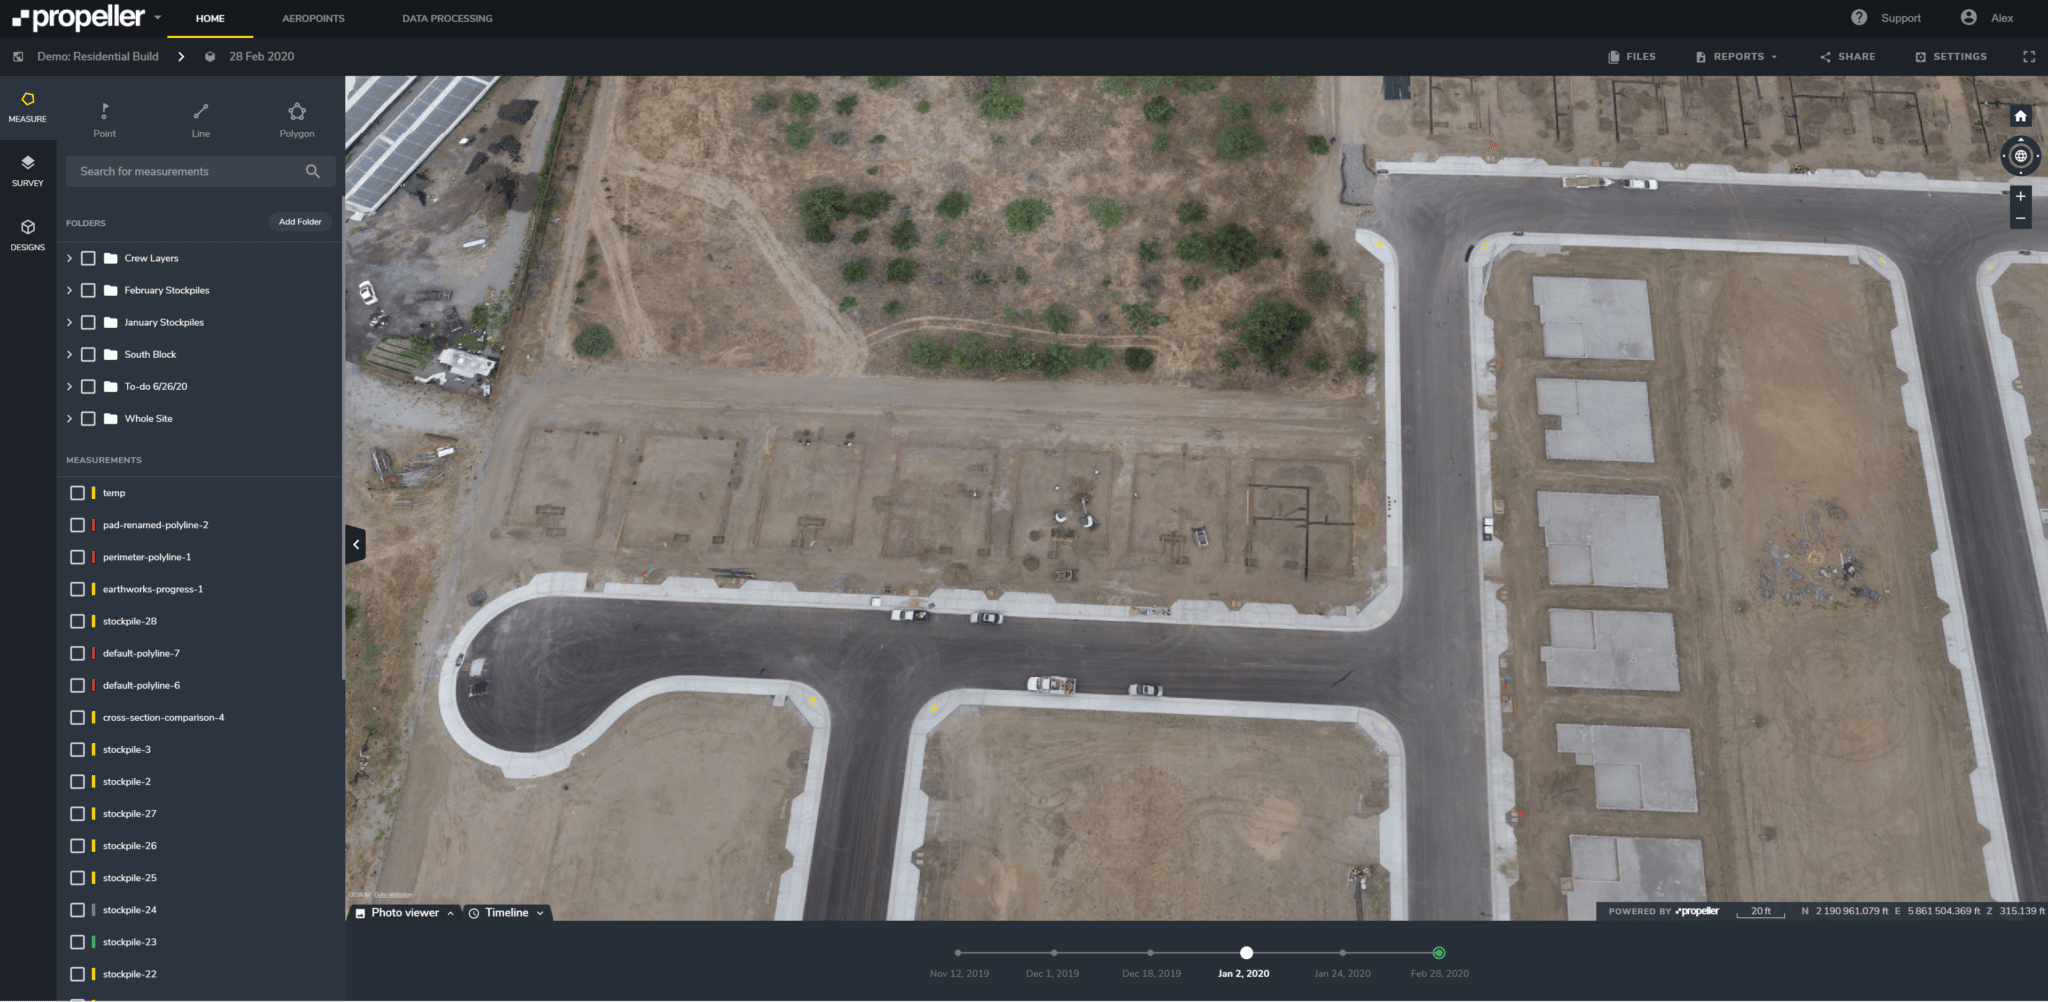
Whether you’re looking at an orthophoto or a 3D model, the Propeller Platform’s Timeline feature empowers you to track changes to your site over time. All you need to do is move the slider along the chronological list of surveys at the bottom of your screen. As you do, the Propeller Platform will pull up the map or model based on those surveys, illustrating how the site has changed.
You can pull out for an overview of your entire site, or zoom in on a particular area. The Propeller Platform will maintain the same view as you scroll through your timeline, so you can track specific changes more easily.
Measuring worksite features throughout the project lifecycle
One of the biggest advantages of our Timeline feature is how it works with our measurement tools. While viewing any survey, you can find the elevation of a given point, the angle of a surface, the volume of a stockpile, and so much more.
Once you’ve generated that measurement, you can scroll through your timeline to see how measurements for that same feature have changed over time. Assuming your surveys are all referenced through the same CRS, the horizontal coordinates of each map and model should line up with each other.
With an accurate, dependable way to measure your earthwork over time, you can improve efficiency at every phase of a project.
Uncovering the source of miswork with regular drone surveys
In addition to tracking your teams’ progress (and the progress of your subcontractors), you can use the Timeline feature as a tool for investigating errors on site.
Let’s say you find out that field teams have been incorrectly moving material for weeks. While that’s a lot of unavoidable rework ahead of you, there’s no reason you should have to make the same mistake twice.
By scrolling through your timeline of surveys, you can see when the mistake was first documented. That way, you’ve isolated the timeframe in which the error took place.
With that information, you can cross-reference with your other records and communication platforms, and hopefully figure out why, when, and with whom the error originated, so you can correct accordingly. The sooner you identify the cause, the sooner you can prevent similar errors from taking place.
The benefits of a seamless progress tracking tool
You don’t need in-depth training to jump into the Propeller Platform and take advantage of our Timeline tool. In fact, we designed it for useability so everyone in your organization—not just CAD and GIS professionals—can log on and quickly compare surveys.
Propeller offers organizations the ability to add as many users as they want to the platform. Office- and site-based managers, engineers, designers, project coordinators, estimators—literally anyone who would benefit from access to worksite progress data can pull it for themselves. With such an accessible Timeline tool at their fingertips, surveying professionals are less burdened by data requests from everyone else.
Check out our case study series: The Journey From Simple Drone Surveys to Worksite Management
Another benefit of the Timeline tool is the ability to clearly illustrate worksite progress for project stakeholders.
Nevada Gold Mines, one of our largest mining customers, flies their stockpiles locations every day. With such regular drone data, they’re able to use the Timeline tool to assess day-to-day material movement in their morning meetings, and plan for the rest of the day accordingly.
Stakeholders with limited or no surveying knowledge can benefit from drone data when it’s presented to them in such a visually engaging format. The same logic applies to updating clients on project momentum. Visually illustrating how earthwork has progressed using the Timeline tool is a lot more digestible than tables of figures in a PDF.
In the end, collecting drone data is only half the progress-tracking battle. How efficiently you use it—to visually track earthwork, catch mistakes, and communicate expectations—is what will set you apart from the competition.