Why stockpile inventory numbers become hard to defend

Read Time: 9 mins
Quick links
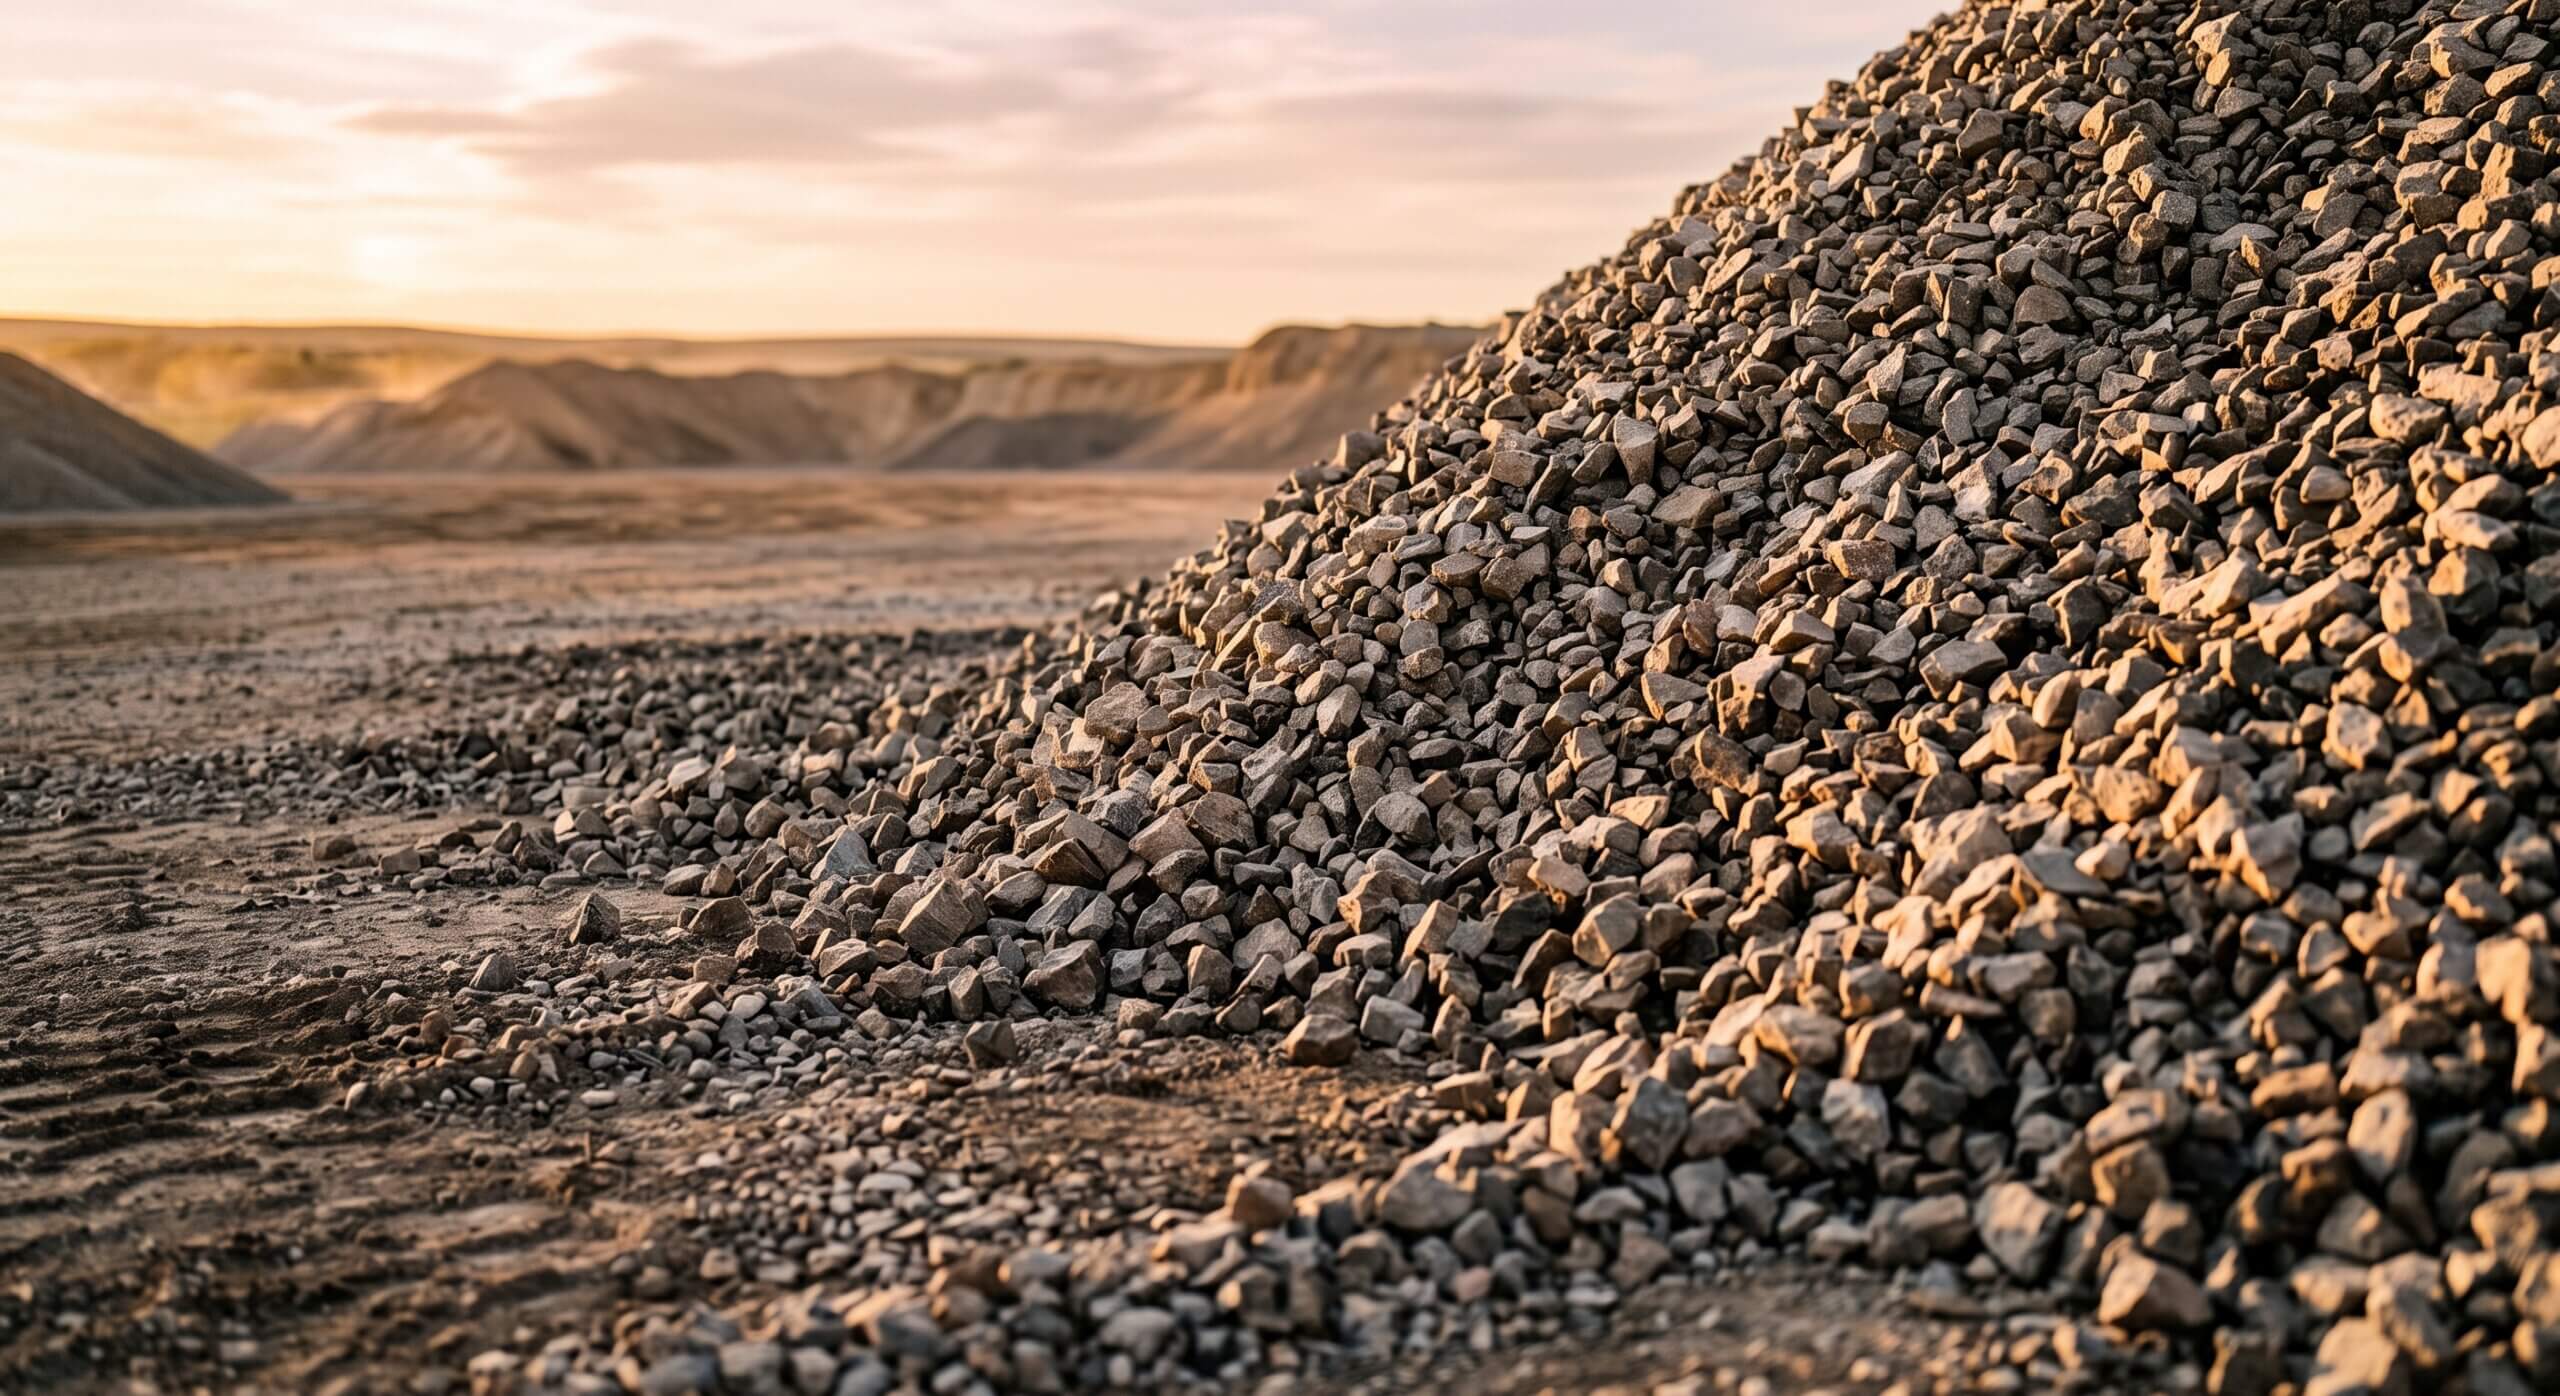
    Close-up of a crushed-rock aggregate stockpile face in warm afternoon light

    Stockpile inventory numbers become hard to defend when methodology, density, cadence, or provenance drift between surveys. This guide maps the six most common drivers and the structural fixes that make your reported volumes reproducible and traceable.

    Summary
    Stockpile inventory numbers become difficult to defend when measurement methodology drifts between surveys, density assumptions are not validated for the actual material, surveys are too infrequent to catch variance early, or volume figures are disconnected from their source through spreadsheet handoffs. Each of these is predictable and fixable, and this article maps all six drivers and what to do about each.

    Why stockpile inventory numbers become hard to defend

    If your stockpile volumes never quite match your books, and the gap is hard to explain, you are not dealing with a measurement problem. You are dealing with a documentation problem. The measurement was probably fine. The trail behind it was not built to hold up.

    This shows up most often in aggregates and mining operations, where the same pile carries a surveyed volume, a book figure, and a plan figure that rarely line up to the decimal. There are six common reasons the number becomes indefensible:

    Survey methodology drifts between periods without being noticed. Density assumptions are not validated for the actual material. Survey cadence leaves too big a gap for variance to be traced. Rehandles and pile transfers go unrecorded. Volume figures are disconnected from their source through spreadsheet handoffs. And boundary or base surface definitions change quietly between surveys.

    None of these are exotic. All of them are fixable. The first step is knowing which one you’re dealing with.

    What “defensible” means (plain English)

    A stockpile number is defensible when three things are true:

    You can explain it. You know what methodology produced it, what density was applied, and what the survey covered.

    You can reproduce it. Someone who was not in the room when it was produced can re-run it from the documentation alone, the same way a survey or engineering reviewer would.

    You can trace it. The number connects back to its source survey, not to a cell in a spreadsheet that has since been overwritten.

    Most operations can explain their stockpile numbers. Fewer can reproduce them. Almost none can trace them through six months of reporting periods without making a call. That gap is where reconciliation disputes, audit findings, and year-end write-downs live.

    The drift problem: why the same stockpile can have multiple truths

    Field reality vs. system numbers

    On any given day, a stockpile has at least three numbers attached to it. The surveyed volume: what the drone model says is physically there, converted to tons. The book inventory: what the ERP or spreadsheet says should be there, based on opening balance plus production minus sales, rehandles, and waste. And the plan system: what the mine or quarry plan says should have moved, based on production targets and sequence.

    All three are constructed numbers. All three can be internally consistent. And all three can disagree.

    Why measurement isn’t the same as inventory reporting

    Measuring a stockpile gives you a volume at a point in time. Inventory reporting turns that volume into a number that someone else will rely on, for a royalty calculation, a finance close, an audit, or a JV partner’s books.

    The gap between those two jobs is where most stockpile disputes start. The measurement was accurate. The reporting trail was not built to hold up.

    The six most common drift drivers

    Every indefensible number traces back to one or more of these. They compound quietly, and the terrain model looks perfect the whole time. Here is what each one does to your reported volume.

    1
    Cadence mismatch
    Surveys lag sales, so every period reconciles against a snapshot that is already weeks old. The gap reads as variance even when nothing was mismeasured.
    2
    Method drift
    Boundary lines and base surface methods shift quietly between surveys. The model stays accurate while the comparison stops measuring the same pile.
    3
    Density assumptions drift
    A conversion figure that no longer matches the material carries through every period. Moisture, fragmentation, and grade all move real density over time.
    4
    Shrink and swell variability
    Swell and shrinkage factors that do not match the material state skew the tonnage conversion. The error stays consistent and hidden across periods.
    5
    Rehandles and pile transfers
    Unrecorded moves show up as a loss on one pile and a gain on another. Site totals still balance, so the shift hides until a single pile is reviewed.
    6
    Spreadsheet handoff
    Once a volume is copied into a spreadsheet, it loses the method, density, and period behind it. The number survives, but the proof does not.

    Cadence mismatch

    If surveys happen monthly and sales are reported weekly, there is always a period of unconfirmed inventory. If the survey falls on the 15th and the reporting period closes on the 31st, two weeks of production and dispatch are reconciled against a 16-day-old snapshot. That is a timing gap rather than a measurement error, but it shows up as unexplained variance every single period.

    Operations that survey every two weeks or weekly can trace variance while the operational context is still live. Operations that survey quarterly are often explaining a gap nobody can reconstruct. Tightening survey cadence is the single cheapest fix on this list.

    Method drift

    Method drift is the most persistent source of unexplained variance, and the least visible. If the polygon boundary around a stockpile shifts between surveys, even a few meters at the toe, the volume delta mixes real material movement with boundary geometry. You cannot separate them after the fact.

    If the base surface method changes from smart base to reference level, or from reference level to custom base, the volume comparison is no longer measuring the same thing. A change that looks like a minor processing decision can produce a 5–15% difference in reported volume for the same physical pile. Neither of these shows up in the terrain model quality. The model is accurate. The method is inconsistent. The output becomes unreliable.

    Density assumptions drift

    Surveyed volume is converted to reported tonnage using a density figure. If that figure does not reflect the material being measured, it can distort the reported tonnage. Published bulking factors, such as roughly 1.12 for sand and gravel and around 1.50 for blasted hard rock, can provide a starting point, but they are not site-specific. Moisture, blasting patterns, fragment size, and material grade all move bulk density over time.

    If density assumptions are not periodically checked against the actual material, the difference between the conversion figure and site conditions can carry through multiple reporting periods. It appears as inventory variance even when part of the difference comes from the density assumption itself.

    Shrink and swell variability

    Related to density, but often tracked separately: the swell factor applied when material is moved, and the shrinkage factor applied when it is compacted or processed. A loader operator, a stockpile, and a haulage route can each interact with swell differently.

    If the swell factor used in reconciliation does not reflect the actual material state, whether bank cubic meters, loose cubic meters, or compacted cubic meters, the tonnage conversion can be consistently overstated or understated across reporting periods.

    Rehandles and pile transfers

    An unrecorded rehandle can appear as a loss from one pile and a gain in another. If both piles are on the same site and total inventory stays unchanged, the movement can be hard to spot until the individual pile is reviewed for something like a royalty calculation or audit.

    Rehandles happen when material moves between product grades, is blended for quality, is shifted to make room, or is transferred from a temporary pile to a permanent one. Recording those movements in the book record keeps the inventory trail intact.

    Spreadsheet handoff breaks provenance

    One common break in the chain of evidence happens when a volume is copied out of the measurement platform and into a spreadsheet or report. Once separated from the original survey, the number can lose important context, including the methodology used, the density applied, and the reporting period it represents.

    If that context is not carried forward with the value, it becomes harder to trace or verify later. Keeping the source survey and calculation details connected to the reported number makes future review and reconciliation much easier.
    What a good process changes

    The fix for all six drift drivers is structural, not technological. Three habits do most of the work.

    STEP 1
    Standardize methodology at the pile level
    Give every pile a documented volume method, boundary rule, and base surface that holds across every survey, no matter who processes it. The number can change. The method should not.
    STEP 2
    Keep numbers connected to their source
    Keep stockpile volumes tied to the platform and the original survey instead of loose in a spreadsheet. Anyone reviewing a figure should see where it came from and how it was built.
    STEP 3
    Create a simple audit trail every period
    Document the survey, methodology, density, and any known variance at every period close. It does not have to be elaborate. It has to exist.

    Standardize methodology at the stockpile level

    Each pile should have a documented volume method, boundary rule, and base surface definition that is enforced across every survey, regardless of who processes it. A consistent methodology makes it far easier to tell whether a variance reflects a real inventory change or just a difference in how the pile was measured.

    Keep numbers connected to their source

    Where possible, keep stockpile volumes connected to the measurement platform and original survey rather than moving them into spreadsheets without supporting context. Anyone reviewing the number should be able to see where it came from and how it was calculated. Reports that carry the pile, volume, tonnage, material, methodology, and source survey together give you a clearer record for review and reconciliation, and they make sharing that record across the team painless.

    The moment a volume leaves the measurement platform as a number in a cell, it is disconnected from the survey it came from.

    Create a simple audit trail every period

    Reconciliation does not require a complex process. It requires a consistent one. At the end of every reporting period, document which survey was used and what methodology was applied, record density and conversion assumptions, compare measured and book figures with sources identified, document the reason for any known variance, and note any follow-up actions and owners. That documentation is the audit trail. It does not have to be elaborate. It just has to exist. Tying it to your reporting rhythm keeps it from slipping.

    Mini self-audit: are your stockpile numbers at risk?

    Answer yes or no to each question. It doubles as a quick site check on your reporting process.

    Do we survey at least monthly for all production-active piles?
    Is the volume calculation method (smart base, reference level, or custom base) documented per pile and enforced consistently?
    Does our polygon boundary reflect the current physical extent of each pile after every survey?
    Is our bulk density figure based on site-validated data, not a published table reference?
    Is our density figure reviewed and updated at least quarterly?
    Are swell and shrinkage factors applied consistently on both the survey side and the book side?
    Are all rehandles and inter-pile transfers recorded in the book inventory?
    Do stockpile volumes stay connected to their source survey, not copied into standalone spreadsheets?
    Can a colleague who was not involved re-run last period’s reconciliation from documentation alone?
    Are all variance explanations written down before the next reporting period begins?

    No to three or more
    Your stockpile reporting is at risk of unexplained variance at the next audit, royalty review, or period-end close.
    No to five or more
    You likely already have unexplained variance that is being absorbed rather than explained. The longer it accumulates, the harder it is to unwind.

    Next steps

    Watch the webinar (on demand): From measured to defensible: how to reconcile stockpiles with confidence. See the reconciliation workflow in action, including common sources of variance, survey cadence, and ways to create a clearer reporting trail. The session also includes audience Q&A on vertical faces, vegetation cleanup, and export options.

    Read the full playbook: The Defensible Stockpile: a reconciliation playbook for aggregates operators. A practical guide to methodology, provenance, and measurement accuracy, with a reconciliation template and audit trail checklist for your team.

    Go deeper on the workflow:

    How to build a defensible stockpile reconciliation process, a step-by-step workflow with a root-cause investigation guide.

    Stockpile reconciliation FAQs, 15 common questions on measurement, density, reporting, and audit trails.

    Frequently asked questions

    If surveyed tonnage consistently trends higher or lower than book inventory, density may be one factor to investigate. First check for differences in survey timing, boundaries, base surfaces, and material movements. Then compare the density figure being used against a recent material test or other site-specific reference.

    Whether drone measurements can be used for royalty or audit purposes depends on the reporting requirements that apply to your operation. Measurement accuracy is only part of the equation. A consistent methodology, clear documentation, and a traceable connection to the source survey all make reported figures easier to review and support. A high-precision ground control workflow with PPK drone mapping helps on the accuracy side, but the documentation trail is what makes a figure defensible.

    Variances that cancel out at the total-site level but are large at the individual pile level usually point to boundary or base surface inconsistency. Two piles that share a boundary zone, or one pile with a custom base applied inconsistently, will trade volume with each other across surveys while the site total stays roughly correct. The fix is a methodology review at the pile level, not the site level.

    As often as you survey. Reconciliation run monthly or every two weeks catches variance while the operational context is still traceable. Reconciliation run annually surfaces variance that has no living explanation. Match your reconciliation frequency to your survey cadence.

    Quick links

      Related articles

      open pit mine

      Rock solid strategies: Propeller’s top 5 workflows for mining and aggregates

      Learn what a point cloud actually is and then how drone data is integrated with…

      Choosing Drone Hardware and Software for Your Drone Program

      In the last few years, commercial drone surveying has been changing and modernizing traditional workflows…

      Four Things That Cause Bad Drone Survey Data

      Uploading drone data to Propeller for processing is a quick and painless part of the drone surveying…

      Ready to learn how Propeller can power up your worksite?

      We’re happy to show you how Propeller can power your worksite, and boost productivity.

      Related articles

      Drone pilot in hi-vis flying a drone next to a crane, with an AeroPoint on the floor.

      Things To Know About Ground Control in Drone Surveying

      Ground control is the go-to option for turning drone data into highly accurate, survey-grade models.…
      DJI M4E flying in the sky

      Propeller’s Drone Guide: DJI Solutions for Commercial Operations

      At Propeller we love testing new drone hardware and we are processing hundreds of drone…

      Telecom Tower Inspection using DJI Phantom 4 Pro: Step-by-Step Guide

      A few weeks ago a new DJI Phantom 4 Pro was delivered to our office.…